Graphing calculators have become a staple in mathematics education, allowing users to visualize functions and their properties quickly. Among these properties, the domain and range of a function are fundamental concepts. The domain refers to all the possible input values (x-values), while the range is all the possible outputs (y-values) a function can have. Understanding how to find these on a graphing calculator is essential for students and professionals alike.
Using the “Calculate” Function
Many graphing calculators feature a built-in “Calculate” function that can help find important values associated with a graphed function, which can give insights into its domain and range.
- Input the function into your graphing calculator.
- Press the graph key to plot the function.
- Access the “Calculate” menu, which is typically found by pressing the “2nd” or “Trace” button.
- Explore the menu options that provide information about the graph such as zeros, minima, maxima, and intersection points, all of which can hint at the domain and range.
Summary: While the “Calculate” function doesn’t directly give the domain and range, it provides valuable information that can be used to deduce them. The ease of use is a clear benefit, though the process may not explicitly define domain or range for complex functions.
Zoom and Pan
Zooming and panning on a graph can help identify behavior at different scales, which is useful for estimating the domain and range.
- Enter the function and graph it.
- Use the zoom in and out features to get a closer or broader view of the function.
- Pan around the graph (using arrow keys or other navigation tools) to observe the continuity and limits of the function.
Summary: This method helps in visually estimating the domain and range but can be limited by the calculator’s screen size and resolution. It’s an easy approach, although it might not be accurate for functions with large or infinite domain and range.
Table Feature
The table feature of a graphing calculator presents numerical values of functions at specific points, which can be used to infer the domain and range.
- Input the function into your calculator.
- Open the table setup menu and define the table start and increment values.
- Review the table of values to estimate the range of output values based on the provided domain.
Summary: The table feature provides a more numerical approach and is especially useful for discrete functions. However, for continuous functions with an extensive domain, this method might be too cumbersome to pinpoint exact bounds.
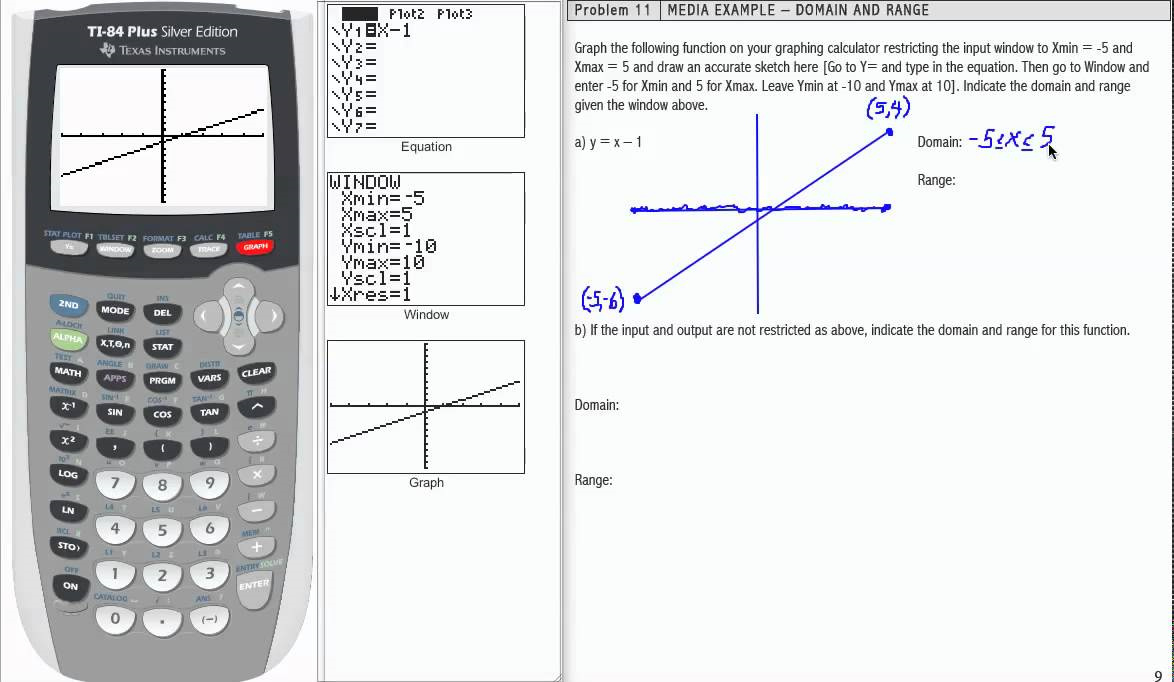
Adjusting Window Settings
Tailoring the window settings allows you to control the viewing rectangle for the graph, which helps in assessing the domain and range.
- Press the “Window” button on your calculator after entering the function.
- Adjust the Xmin, Xmax, Ymin, and Ymax values to set the viewing parameters.
- Observe the graph within these constraints to get a clearer picture of the domain and range.
Summary: Adjusting window settings offers precise control over what portion of the graph you see and can enhance understanding of the function’s behavior. However, this may not provide a complete picture for functions that stretch beyond the set window.
Using the “Value” Function
The “Value” function allows you to input specific x-values and find the corresponding y-values, aiding in discerning the function’s range.
- Graph the function.
- Access the “Calculate” or similar menu.
- Select the “Value” function and input different x-values to observe corresponding y-values.
Summary: This method can be very accurate for testing specific points but can be inefficient for identifying an overall range for complex functions.
Trace Feature
Tracing a function’s graph provides a real-time output value for any point along the curve, useful for visual learners in understanding the range.
- Graph the function.
- Use the “Trace” function to move along the graph.
- Note the output (y) values as you move across different input (x) points to understand the range.
Summary: Tracing is interactive and helps build a qualitative understanding of a function, but it might not be precise for finding exact domain and range limits.
Ask for Help Feature
Some calculators come with a help feature that provides guidance on using its functions, including finding domain and range.
- Locate and access the help feature on your calculator.
- Follow the prompts or instructions provided to understand how domain and range can be estimated.
- Apply the given advice to the specific function you are examining.
Summary: The built-in help is beneficial for beginners, offering targeted advice for using the calculator. The downside is that not all calculators have this feature, and the advice may be too general at times.
Using Graph Database or Presets
Graphing calculators often have preset graphs or a database of functions where domain and range are identified.
- Access the graph database or presets in your calculator.
- Compare these preloaded graphs with your function to estimate the domain and range.
- Use this as a reference to understand how different functions behave.
Summary: This is a quick way to learn about domain and range for common functions, but it may not apply to more unique or complex functions you encounter.
Use of Inequalities
Graphing inequalities instead of functions can visually represent the range on your calculator.
- Input the inequality in your calculator that represents the function’s range.
- Graph the inequality and observe the shaded area, which indicates the range.
- Use the graph to window feature to fine-tune the viewing area for better understanding.
Summary: This method provides a visual representation of the range but requires an understanding of inequalities that correspond to the function’s range. It might be less intuitive for those unfamiliar with graphing inequalities.
Graphical Numerical Solver
Some advanced calculators feature a solver that can numerically estimate roots, extremes, and intersect points, indirectly related to domain and range.
- Access the solver feature.
- Set up equations or expressions that need to be solved in relation to the function’s graph.
- Use the solutions provided to infer information about the domain and range.
Summary: Even though this is a powerful tool, it requires a solid understanding of the equations needed to be solved, which may be a step too complicated for some users.
Conclusion
Calculating the domain and range of a function using a graphing calculator is a skill that leverages technology to deepen one’s understanding of mathematical concepts. While the techniques range from simple observation to utilizing sophisticated built-in features, each approach has its unique benefits and potential drawbacks. Understanding these methods will enhance both learning and teaching experiences and provide a solid foundation for tackling diverse mathematical challenges.
FAQs
Q: What is the domain of a function?
A: The domain of a function is the set of all possible input values (x-values) for which the function is defined.
Q: What is the range of a function?
A: The range of a function is the set of all possible output values (y-values) that the function can produce.
Q: Can a graphing calculator find the domain and range automatically?
A: Most graphing calculators do not directly find the domain and range automatically, but they offer tools and features such as graphing, table, and calculate functions that can help you determine them.