In statistics, getting a firm grasp on key concepts can enable us to make sense of data collected from surveys, experiments, and research. One such concept is the calculation of p-hat §, which represents the proportion of successes in a sample. Whether you’re a student facing your first statistics project or a professional analyzing data, understanding how to calculate p-hat correctly is crucial. It serves as a stepping stone to more advanced statistical analysis and hypothesis testing.
Proportion Basics
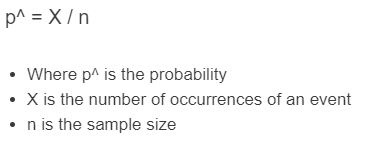
Before diving into p-hat calculation, it’s essential to understand what a proportion in a statistical context means. A proportion is a type of ratio that indicates what fraction of the total population exhibits a particular feature or characteristic.
Steps:
- Identify the total number of observations in your dataset (n).
- Count the number of times the specific characteristic you’re studying occurs (x).
- Calculate the proportion by dividing the count of characteristic occurrences by the total number of observations (p = x/n).
Summary:
Understanding proportions is the fundamental step toward calculating p-hat. It’s a simple and intuitive process, but it’s necessary to be accurate in counting occurrences and the total number of observations. The potential downside is human error in counting, which directly affects the result.
Using a Calculator
With the availability of scientific calculators, computing p-hat becomes much easier and faster.
Steps:
- Input the number of successes into your calculator.
- Press the division key (/).
- Input the total sample size.
- Press the equal key (=) to obtain the proportion, p-hat.
Summary:
Using a calculator is quick and reduces manual calculation errors. However, it’s still prone to human error if the wrong numbers are entered.
Excel Formula
Excel is a powerful tool for handling statistical data, and you can calculate p-hat using a simple formula.
Steps:
- Input your data into two separate columns in Excel, one for successes and one for the total number of trials.
- Click on a cell where you want the p-hat result to appear.
- Type in the formula “=A2/B2” (assuming A2 contains the number of successes and B2 the total number of trials).
- Press ‘Enter’ to see the proportion.
Summary:
Excel automates calculations and minimizes human error, providing a convenient way to work with large datasets. However, incorrect formula entry or data placement can lead to errors.
Google Sheets Formula
Like Excel, Google Sheets offers a user-friendly platform to calculate p-hat.
Steps:
- Enter your values into two columns in Google Sheets.
- In a new cell, type in the formula dividing the successes by the total number of trials.
- Hit ‘Enter’ to get your p-hat value.
Summary:
Google Sheets is accessible from any device with internet, and being cloud-based, it saves your work automatically. The cons include potential internet connectivity issues, which can disrupt your work.
Statistical Software
Software like SPSS or R provides more sophisticated options for handling statistical data and calculating p-hat.
Steps:
- Enter the data into the software.
- Use the built-in functions or code snippets to calculate the proportion (consult the software’s help resource for specific commands).
- Run the function or code to get p-hat.
Summary:
The statistical software offers precision and is designed for complex analyses, but requires familiarity with the software’s functions and commands, which can be a steep learning curve for beginners.
Sampling Distribution
Understanding how p-hat plays a role in the sampling distribution of a proportion gives insight into the reliability of your calculations.
Steps:
- Calculate p-hat for several samples.
- Plot the p-hat values to observe the sampling distribution.
- Analyze the distribution’s shape, which should approach normality with a large enough sample size.
Summary:
This method provides a deeper understanding of variance and standard error. The downside is it requires multiple samples and can be time-consuming.
Confidence Intervals
Adding confidence intervals around your p-hat can give you an idea of where the true population proportion might lie.
Steps:
- Calculate the standard error of p-hat.
- Apply the formula to find the confidence interval.
- Interpret the interval within your specific confidence level (e.g., 95%).
Summary:
Confidence intervals offer context to your p-hat value and are vital for hypothesis testing, although they may be slightly complex for beginners to understand without statistical knowledge.
P-hat in Hypothesis Testing
P-hat is commonly used in hypothesis testing to assess theories about population proportions.
Steps:
- Set up your null hypothesis.
- Calculate p-hat based on your sample data.
- Determine the test statistic using p-hat and the assumed population proportion under the null hypothesis.
- Interpret the results against the critical value or p-value.
Summary:
The main benefit is the ability to make informed decisions based on sample data. However, misuse or misinterpretation of hypothesis testing can lead to incorrect conclusions.
Margin of Error
Understanding the margin of error in conjunction with p-hat can offer insights into potential sample variability.
Steps:
- Identify the confidence level for your data.
- Calculate the standard error.
- Multiply the standard error by the z-score corresponding to your confidence level.
- Interpret this margin around your p-hat.
Summary:
The margin of error is crucial for interpreting survey results but requires an understanding of z-scores and standard errors that may confuse beginners.
Teaching Tools and Simulations
Interactive simulations and teaching tools can help visualize how p-hat works and relates to sampling.
Steps:
- Find online simulations or educational software that demonstrates p-hat calculation and sampling distributions.
- Follow the instructions to input data and run simulations.
- Observe how changing sample sizes and success counts impacts p-hat.
Summary:
These tools create a hands-on learning experience that can help solidify understanding. However, they may not cover every aspect of p-hat calculations in depth.
Calculating p-hat, the sample proportion, isn’t just about performing arithmetic; it’s about understanding a key statistical concept used in a variety of data analyses. Each of the methods discussed provides a different pathway to the same destination, offering a toolkit for any situation you might face in the realm of statistics.
Conclusion:
Whether you’re conducting simple surveys or involved in more intricate statistical modeling, knowing how to calculate p-hat is vital. The methods outlined provide multiple ways to approach this task, ensuring you can find a technique that aligns with your resources and comfort with technology. Always remember, the beauty of statistics lies in its ability to take numbers and imbue them with meaning, translating raw data into insights that can guide decisions and drive understanding.
FAQs:
-
What is p-hat?
P-hat is the symbol used to represent the sample proportion, or the ratio of the number of success outcomes to the total number of trials in a sample. -
Why is it important to calculate p-hat?
Calculating p-hat is important for statistical analysis, hypothesis testing, and making predictions about a larger population based on sample data. -
Can p-hat be greater than 1 or less than 0?
No, p-hat represents a proportion and therefore must be between 0 and 1, inclusive. -
How does sample size affect the calculation of p-hat?
A larger sample size generally leads to a more accurate estimate of the population proportion, as it reduces the effect of variability and chance. -
Is there a difference between p-hat and the population proportion?
Yes, p-hat is an estimate of the population proportion based on a sample. It is an approximation, while the population proportion is the actual ratio in the entire population.