Welcome to your straightforward guide to monitoring CPU usage on your Raspberry Pi! Whether you’re running projects or just curious about how your tiny but mighty device is performing, keeping an eye on CPU usage can be invaluable. It’s like getting a peek into the brain of your Raspberry Pi, ensuring it’s running smoothly and not being overworked. This simple process will be like checking the speedometer on your car; it tells you how fast you’re going but in this case, it’ll show how hard your processor is working. Ready to become a Raspberry Pi CPU usage pro? Let’s get started!
Solution 1: Using top Command
Introduction
The top command is a powerful utility found in the Linux operating system, which forms the core of Raspberry Pi OS. This tool provides a dynamic, real-time view of what is happening within the system. It can display a variety of vital system statistics, but most notably, it showcases CPU usage in an easy-to-understand format. The output includes information on CPU utilization by each process, memory usage, and system uptime, among other things. Since top comes pre-installed with the Raspberry Pi OS, it is an accessible and convenient way to check your CPU usage without needing to install additional software.
Steps
- Opening Terminal: Start by accessing the terminal on your Raspberry Pi. You can do this by clicking on the Raspberry icon in the top left corner, navigating to “Accessories,” and then selecting “Terminal.”
- Running the
topCommand:- In the terminal window that opens, type the command
topand press Enter. - After a short moment, you will see a list of running processes and various pieces of information about the system resources.
- In the terminal window that opens, type the command
- Understanding the Display:
- The very first line indicates the current time, how long the system has been running, the number of users logged in, and the load averages.
- The second and third lines display information pertaining to tasks — how many are running, sleeping, stopped, or zombie processes.
- The next few lines provide memory and swap usage.
- Pay particular attention to the “%Cpu(s)” line, which shows CPU usage. The numbers represent the percentages of total CPU power being used. There will be values for user processes, system processes, idle time, and others.
- Identifying Process CPU Usage:
- Directly below the summary, you’ll find a table of current processes. The “%CPU” column shows how much CPU each process is using.
- To sort the list by CPU usage, press Shift + P. This will rearrange the list so that the process using the most CPU is at the top.
- Exiting
top:- To exit
top, simply press ‘q’. This will return you to the standard terminal command prompt.
- To exit
Summary
Using the top command is beneficial because it’s an immediate and straightforward way to view CPU usage on your Raspberry Pi. You don’t need any extra software, and it’s a lightweight tool that won’t heavily impact system performance when in use. Furthermore, it offers a real-time overview, which is constantly updated. This can be crucial for diagnosing issues as they happen.
However, for users who are new to the Linux environment, the information displayed by top may seem overwhelming at first. The user interface is also quite basic, consisting of purely text and numbers, which may not be as inviting for those who are more accustomed to graphical tools. Despite these potential downsides, top remains a fundamental and powerful utility for both novice and advanced users to monitor and manage CPU usage effectively on their Raspberry Pi.
Utilizing htop
Introduction
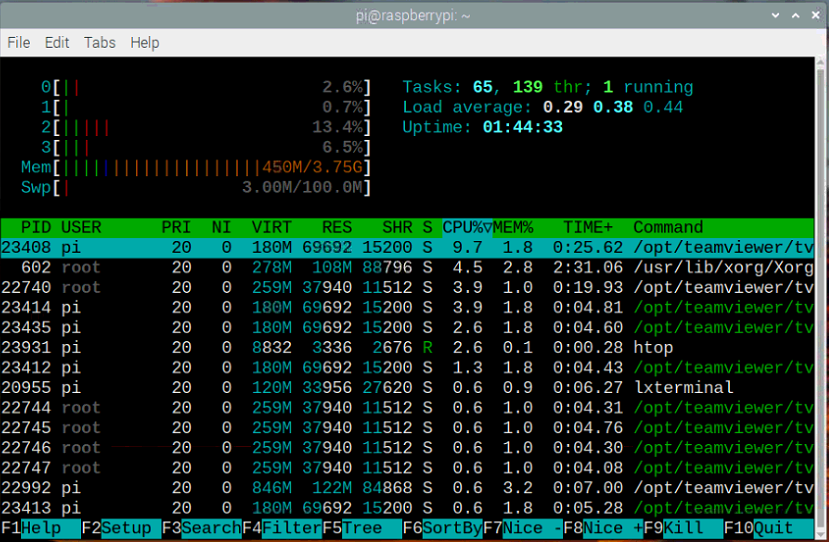
When working with a Raspberry Pi, monitoring the CPU usage can be crucial for ensuring that your projects and applications run smoothly without overloading the system. htop is a powerful tool that can be incredibly helpful in achieving this. Unlike the more basic top command, htop provides a colorful, interactive interface, making it much easier for those without a technical background to understand their system’s performance.
The htop interface organizes information in a visually appealing manner, displaying CPU, memory, and swap usage with meter-like graphs. It also lists all running processes and allows users to perform tasks such as sorting the processes by various criteria and killing misbehaving processes without the need to enter their Process ID. This can make htop a more user-friendly option for Raspberry Pi users, especially those who prefer a graphical representation of their system’s performance.
Steps
To utilize htop on your Raspberry Pi, you’ll need to install it and then execute it via the terminal. Here’s how to do it step by step:
- Open the Terminal
The terminal is like a window to your Raspberry Pi’s soul. To open it, you’ll click on the little black rectangle icon with a “>”, similar to retro TVs, located along the top menu of your screen. - Update the Package Lists
Before installing new software, it’s good practice to update the package lists. You can think of it as refreshing your catalog before shopping. Type the following command and then hit Enter:
sudo apt-get update- Install htop
Now it’s shopping time! To pickhtopoff the virtual shelf and install it on your Raspberry Pi, type the following command and press Enter:
sudo apt-get install htop- Run htop
With the installation complete, it’s time to open your new tool. Just typehtopinto your terminal and press Enter. You’ll be greeted with a colorful display of stats and figures – that’s the face of your Raspberry Pi’s CPU usage. - Interacting with htop
You can interact withhtopusing your keyboard. The arrow keys allow you to highlight different processes, the “F9” key opens the kill menu to terminate a process, and “F6” lets you sort processes. There’s no need for a mouse here; your keyboard is the magic wand. - Exit htop
When you’re done perusing your CPU usage and you want to return to the regular screen, simply press “F10” or “q”. It’s the polite way of saying goodbye tohtop.
Summary
Using htop provides a dynamic and intuitive way to check on your Raspberry Pi’s CPU usage. Its advantages include an easy-to-read interface, simple navigation and process management, and real-time updates. This can be especially beneficial for beginners or those who prefer visual aids over plain text. However, htop is slightly more resource-intensive than top, and while this is generally not a problem for most Raspberry Pi models, it’s something to keep in mind if you’re working with a particularly resource-sensitive task. Additionally, since htop displays a lot of information, users might find it overwhelming at first, but with a bit of exploration, it quickly becomes clear and useful.
3. Implementing vmstat
Introduction
Understanding how your CPU is performing can be vital, especially if you’re running complex tasks on your Raspberry Pi or simply trying to optimize its performance. One tool that can help you get a snapshot of your CPU’s activity is vmstat, which stands for “virtual memory statistics”. This tool goes beyond just informing you about the CPU usage; it provides comprehensive insights into processes, memory, paging, block IO, traps, and overall CPU activity.
vmstat is part of the default toolset in most Unix-like operating systems, including the Linux distribution that runs on Raspberry Pi. With its command-line interface, vmstat presents its output in an orderly fashion, updating in real-time for continuous monitoring or at intervals of your choosing for periodic checks.
Now, let’s go through the steps to check your CPU usage with vmstat on the Raspberry Pi.
Steps
- Open the Terminal: Access the terminal on your Raspberry Pi. You can do this by using SSH to connect remotely or by opening a terminal window if you’re working directly with the Raspberry Pi’s desktop environment.
- Update your System (optional but recommended): Before proceeding, it’s a good idea to ensure your system is up-to-date. Run the following commands:
   sudo apt update
   sudo apt upgrade
This will ensure all your system’s software is current, which includes the latest version of vmstat if any updates are available.
- Run
vmstat: Enter thevmstatcommand in the terminal to see your CPU usage. By default,vmstatreturns a single snapshot of the current system performance. Type the following and press Enter:
vmstat- Understand the Output: The command outputs several columns. Focus on the following:
procs: This section shows the process-related information.r: The number of processes waiting for run time.b: The number of processes in uninterruptible sleep.
memory: This displays memory usage information.swpd: The amount of virtual memory used.free: The amount of idle memory.buff/cache: Memory used for buffers and cache.
swap: Swap memory information, like memory being moved from RAM to disk.io: Input/Output operations.bi: Blocks received from a block device.bo: Blocks sent to a block device.
system: System-level indicators.in: The number of interrupts per second.cs: The number of context switches per second.
cpu: This is the key section for CPU usage.us: Time spent running non-kernel (user) code.sy: Time spent running kernel (system) code.id: Time spent idle.wa: Time spent waiting for IO.st: Time stolen from this VM by the hypervisor (often 0 for physical systems like a Raspberry Pi).
- Continuous Monitoring (optional): If you want to see the output continuously updated every few seconds, you can add a delay parameter. For example, to update every 5 seconds:
vmstat 5- Exit
vmstat(if running continuously): To stop the continuous output, simply pressCtrl + C.
Summary
Using vmstat is highly beneficial for getting a quick, straightforward readout of your Raspberry Pi’s CPU and system performance. It offers a glimpse into how your processes are interacting with the system’s resources in real-time or in specified intervals. This can help pinpoint performance issues and ensure that your Raspberry Pi is running as efficiently as possible.
On the flip side, vmstat does present data in a raw form, which might be intimidating for beginners. There is also a learning curve associated with understanding the significance of each metric provided by vmstat. Nonetheless, with the straightforward steps provided and a little practice, even users without much technical knowledge can learn to monitor their Raspberry Pi’s CPU usage effectively using vmstat.
4. Exploring mpstat
Introduction
When working with a Raspberry Pi—or indeed any computer—it’s useful to understand how the central processing unit (CPU), the brain of your Raspberry Pi, is performing. Whether you’re running complex computations, crunching numbers, or simply using it as an everyday computer, being aware of your CPU’s performance can help you diagnose slowdowns and optimize your tasks for better performance. One of the tools for monitoring CPU performance is called mpstat.
mpstat stands for multi-processor statistics and is a command-line utility that is part of the sysstat package. This package is not usually pre-installed on Raspberry Pi OS, but it can be easily added. Mpstat is particularly beneficial for systems with multiple cores because it can report usage statistics for each core individually, allowing a granular view of how multi-threaded applications are interacting with the CPU.
Steps
Installing sysstat and Using mpstat
- Open the Terminal: Access the terminal on your Raspberry Pi, which is where you will enter the commands for installation and use of
mpstat. - Update Your System’s Package List: Make sure your list of available packages is up to date by running the following command:
sudo apt update- Install
sysstat: Now, install thesysstatpackage which contains thempstatutility with the following command:
sudo apt install sysstat- Enable
sysstatData Collection: By default, some distributions may not havesysstat‘s data collection functionality enabled. To enable it, edit the/etc/default/sysstatfile changingENABLEDfrom “false” to “true”:
sudo nano /etc/default/sysstatSave the file (with CTRL + O, then Enter) and exit (with CTRL + X) after making the change.
- Restart
sysstatto Apply the Changes:
sudo service sysstat restart- Running
mpstat: After installation, you can runmpstatto check CPU usage. Simply type:
mpstatThis command will give you a summary of CPU usage on your Raspberry Pi.
- View Individual Core Statistics: If your Raspberry Pi has multiple cores and you want to see how each core is performing separately, you can use the following command:
mpstat -P ALLThis will provide statistics for each individual core, including user and system-level usage.
Summary
Using mpstat allows you to monitor your Raspberry Pi’s CPU activity in detail, including each core’s utilization in multi-core systems. This can be incredibly useful for optimizing performance and ensuring your applications are running smoothly.
The benefits of using mpstat are its granularity, accuracy, and the ability to view historical usage data by collecting it over time. However, interpreting the data mpstat provides can be complex for those with less technical expertise, and the necessary installation and command-line operations might seem daunting at first. Nonetheless, with the simplicity of the outlined steps above, even users with minimal technical knowledge can effectively check their CPU usage on a Raspberry Pi.
5. Deploying nmon
Introduction
nmon, which stands for Nigel’s Monitor, is a versatile system’s performance monitoring tool for the operating systems derived from UNIX, including Linux distributions like Raspberry Pi OS. It is widely recognized among system administrators for its capacity to provide real-time analysis of multiple system resources simultaneously. The nmon tool is beneficial because it consolidates numerous performance metrics into a single screen with various modes, displaying live statistics for CPU, memory, disk I/O, network, NFS, and more. This makes nmon a comprehensive tool for diagnosing system health and identifying bottlenecks. Unlike some similar tools, nmon also allows users to capture performance data for later analysis, which is ideal for debugging and long-term performance reviews.
Steps
To use nmon to check CPU usage on your Raspberry Pi, you can follow these straightforward steps:
- Installation:
- Begin by opening the terminal on your Raspberry Pi. You can do this by using the terminal icon on the desktop if you are using the graphical desktop environment, or by connecting to your Raspberry Pi via SSH (Secure Shell) if accessing it remotely.
- Update your Raspberry Pi’s package list by typing:
sudo apt update - Install the
nmontool by entering the following command:sudo apt install nmonand pressing Enter. Confirm the installation when prompted.
- Launching
nmon:
- Once the installation is complete, you can start
nmonby simply typingnmonand pressing Enter in the terminal.
- Navigating
nmon:
- When
nmonstarts, you will be presented with a variety of system statistics. By default, it may already show CPU usage along with other metrics. - To focus specifically on CPU usage, press the ‘c’ key on your keyboard. This will highlight CPU usage statistics, providing you with real-time CPU performance data.
- For a detailed view of specific CPU cores (if your Raspberry Pi has multiple cores), press ‘1’. This will split the CPU view to show individual cores and their utilization.
- Understanding the Display:
- The CPU usage statistics are displayed in a series of bar graphs or numeric percentages, depending on the chosen mode. The metrics include user, system, wait, and idle percentages, which tell you how much of the CPU’s capacity is being used and what it’s being used for at any given moment.
- Saving the Data (optional):
- If you wish to save the performance data for analysis at a later time, you can run
nmonwith additional parameters that specify the file to save to and the duration and interval of capturing data. For example, usingnmon -fT -s 30 -c 120would save data every 30 seconds, 120 times, to a timestamped file.
- Exiting
nmon:
- To exit
nmon, simply press ‘q’. This will return you to the normal terminal prompt.
Summary
Using nmon on Raspberry Pi is beneficial due to its all-encompassing approach to system monitoring. This tool is especially helpful for those who require a deeper dive into their system’s performance characteristics in real-time, as it aggregates a wealth of information into an efficient, terminal-based interface. One of the key advantages is its ability to capture data over a period which aids in identifying trends and making long-term performance improvements.
However, nmon may be intimidating to new users because of the sheer amount of data presented and the need to familiarize oneself with various toggle commands to view different types of information. Its text-based interface, while powerful, lacks the intuitiveness of a graphical interface. Therefore, while nmon provides an excellent resource for those looking to get a comprehensive overview of system performance, it might not be the best choice for absolute beginners who prefer simple, graphical presentations of data.
6. Accessing Raspberry Pi Desktop Task Manager
Introduction
The Raspberry Pi is a wonderful piece of technology that serves as an educational tool, a hobbyist’s delight, and even a cost-effective computer for daily tasks. For those who have taken the plunge and are using Raspberry Pi Desktop, there comes a moment when you might need to check how your little computer is managing its workload. This often boils down to checking the CPU usage to ensure it is not overtaxed, which could lead to performance degradation. The Raspberry Pi Desktop environment includes a built-in graphical tool similar to the Task Manager in Windows or the Activity Monitor in macOS, that allows you to do just that – view and manage your CPU usage without ever touching the command line. This built-in Task Manager or System Monitor application is straightforward and user-friendly, perfect for people with minimal technical knowledge.
Steps
To check CPU usage on your Raspberry Pi using the Desktop Task Manager, follow these steps:
- Access the Task Manager:
- Navigate to the top menu bar on your Raspberry Pi desktop.
- Locate and click on the ‘Menu’ button (usually represented by the Raspberry Pi logo).
- In the menu, hover over the ‘Accessories’ option to expand the accessory list.
- Look for ‘Task Manager’ or ‘System Monitor’ in the list, then click on it. This action will launch the Task Manager application.
- View CPU Usage:
- Once the Task Manager or System Monitor window is open, you’ll find several tabs such as ‘Processes’, ‘Resources’, ‘File Systems’, and perhaps more, depending on your version of the Raspberry Pi OS.
- Click on the ‘Resources’ tab to view a real-time graph of your CPU usage.
- Here, you can observe the percentage of CPU being used in real-time. This graph will fluctuate as your Raspberry Pi performs various tasks.
- Analyze Process-specific Usage:
- In the ‘Processes’ tab, you’ll see a list of all the running processes.
- This list typically includes process names, user names, CPU usage percentage, and memory usage.
- You can sort this list by CPU usage by clicking on the ‘CPU %’ column header, making it easy to identify which processes are using the most CPU resources.
- Manage Processes:
- If a particular process is using too much CPU, you may decide to end it to free up resources.
- To do this, right-click on the process you wish to terminate and select ‘End Process’ or ‘Kill Process’ from the context menu.
- Be cautious when ending processes, as ending essential system processes may cause instability or require a restart of your Raspberry Pi.
Summary
Using the Raspberry Pi Desktop Task Manager to check CPU usage is a simple and effective way to keep an eye on your system’s performance. The benefits of using this tool are its ease of access and use, the ability to visually track resources in real-time, and the option to manage processes without requiring the command line or additional software installation.
On the downside, the graphical Task Manager may not provide as much detailed information as some of the command-line tools. Also, if your Raspberry Pi is running headless (without a monitor) or you are accessing it remotely via SSH, then accessing the Desktop Task Manager is not feasible, and you would need to resort to one of the command-line methods mentioned earlier. Despite this, for everyday use with access to the desktop environment, the Task Manager is an invaluable tool for beginners and seasoned users alike.
7. Using glances
Introduction
Glances is an advanced, cross-platform monitoring tool that offers a comprehensive snapshot of a system’s resources in a clear and condensed format. It’s written in Python and uses the psutil library to fetch data, making it capable of running on almost any operating system, including all versions of the Raspberry Pi OS. For users of Raspberry Pi, who might be running a variety of projects ranging from simple educational tools to complex automation systems, glances provides an invaluable insight into the health and performance of the device. Whether you’re a hobbyist, educator, or professional developer, understanding CPU usage is key to maintaining efficient operations, troubleshooting issues, and optimizing the workload distribution.
Steps
- Installation: First, you need to install
glanceson your Raspberry Pi. Open the terminal by clicking on the terminal icon on the taskbar or using the keyboard shortcut Ctrl+Alt+T. Then enter the following command and press Enter:
sudo apt-get install -y glancesThis uses the package manager to download and install glances and all its dependencies.
- Running Glances: Once
glancesis installed, you can start the monitoring tool by simply typingglancesin the terminal and pressing Enter. It will take a few seconds to gather data and then display an interactive screen in the terminal window. - Interpreting the Data: The interface is divided into several sections. The CPU section shows the total CPU usage as well as usage for user processes, system processes, and idle time. If your Raspberry Pi has multiple cores,
glanceswill also display individual stats for each core. - Navigating Glances: Use the arrow keys to scroll up and down through the processes list if it extends beyond the height of the terminal window. You can also use the F2 key to access the setup screen, F3 to search for a process, and other function keys as indicated at the bottom of the
glancesinterface. - Refreshing Rate: By default,
glancesupdates the display every second, but you can specify a different rate by runningglances -t SECONDS, whereSECONDSis the number of seconds between updates. - Exiting Glances: To exit
glances, simply pressqorCtrl+C. - Additional options:
glancescomes with a web mode that lets you view system stats from a web browser, run withglances -wand open your browser to the indicated address.
Summary
Glances is a flexible and easy-to-use tool that provides an abundance of information. This makes it invaluable for monitoring the CPU usage on your Raspberry Pi in real-time. It consolidates comprehensive system metrics into a single interface, which means less flipping between different utilities to get a full picture of your system’s health. While glances is user-friendly, the wealth of information it provides can be overwhelming at first, and it might take some time for beginners to interpret the data effectively. Additionally, the additional features such as web mode extend the utility’s functionality without the need for complex setup processes. However, because it’s a terminal-based tool, users who are more comfortable with graphical user interfaces might find it a bit challenging initially. Despite this, learning to use glances can significantly aid in the efficient and effective management of your Raspberry Pi’s resources.
8. Installing cpustat
Introduction
cpustat is a lesser-known monitoring tool that provides insights into CPU usage by processes. Unlike some other tools, cpustat does not come pre-installed on most systems; however, it can be easily added to your Raspberry Pi. It’s designed to be straightforward to use and is ideal for users who need to quickly identify which processes are consuming the most CPU resources. One of the main advantages of cpustat is its simplicity — it focuses on providing clear CPU usage statistics without overwhelming the user with too much information.
Steps
- Installing
cpustat:
Before you can usecpustaton your Raspberry Pi, you need to install it. Open a terminal window and update your package list by typing:
sudo apt updateThen, install cpustat with the command:
sudo apt install cpustatThis step will download and install cpustat on your Raspberry Pi.
- Running
cpustat:
Once the installation is complete, you can start usingcpustatright away. Simply type:
cpustatin the terminal and press enter. The command will start monitoring your CPU usage immediately.
- Interpreting the output:
Thecpustatoutput is divided into several columns. You’ll see process IDs, the user who owns the process, the CPU utilization percentage, and the command name for the process. - Customizing
cpustat:
You can runcpustatwith various options to tailor its behavior. For example, if you want to update the statistics more frequently, you can use the-iflag followed by a time in seconds:
cpustat -i 1The above command will refresh CPU usage information every second.
- Stopping
cpustat:
When you’re finished monitoring CPU usage, you can stopcpustatby pressingCtrl + Cin the terminal. This key combination sends an interrupt signal tocpustat, safely ending the monitoring session.
Summary
Utilizing cpustat provides a clear and concise display of which processes are using the CPU and to what extent, which can be extremely beneficial for diagnosing performance issues or ensuring efficient resource usage. Installation and use are simple enough for non-technical users, yet the information provided is valuable for those with more technical experience as well.
The primary benefit of cpustat is its focused approach to presenting CPU usage data without extraneous details. However, its simplicity can also be a downside for users who require a comprehensive analysis of their system performance, as cpustat does not provide memory, network, or disk I/O statistics like some other tools. For users who are only interested in CPU metrics, cpustat is an excellent and user-friendly choice.
9. Utilizing dstat
Introduction
dstat is a powerful and user-friendly tool that combines the capabilities of several other performance monitoring utilities like vmstat, iostat, netstat, and ifstat. It is designed to provide a holistic view of system resources in real-time, making it an essential tool for system administrators and power users alike who want to keep an eye on their system’s performance, especially on devices with limited resources like the Raspberry Pi. The tool is flexible and allows users to view all system resources instantly, drill down to analyze specific issues, and even save the data to a file for later analysis. For those not well-versed in technical jargon, think of dstat as a health monitoring screen for your Raspberry Pi, showing you vital stats on how hard it’s working and how much of its brain power is being used at any given moment.
Steps
To check your CPU usage using dstat on your Raspberry Pi, follow these simple steps:
- Installing
dstat:
- Open the terminal on your Raspberry Pi. This can usually be done by clicking on the terminal icon on the desktop or by using a keyboard shortcut, typically
Ctrl + Alt + T. - Before installing new software, it’s good practice to update your package lists. Enter the command
sudo apt-get updateand pressEnter. - Once your package lists are updated, install
dstatby enteringsudo apt-get install dstatand pressEnter. Confirm the installation if prompted.
- Running
dstat:
- Simply type
dstatin your terminal and pressEnter. This will start the tool, and you’ll see a continuously updating table of stats. - By default,
dstatdisplays the CPU usage, disk activity, network activity, paging, and system statistics in a one-second interval.
- Understanding the output:
- The CPU-related columns are usually labeled
usr,sys,idl,wai, andst. These signify user, system (kernel), idle, waiting (IO wait), and stolen (by other virtual hosts) times for your CPU, respectively. You want the idle time (idl) to be high when you’re not doing much, which means your CPU has breathing room. - By looking at these numbers, you can get a quick snapshot of what’s consuming your CPU’s power, whether it’s mostly being used by user processes (
usr) or system processes (sys), and whether it’s being bogged down by waiting for input/output operations (wai).
- Customizing the
dstatoutput:
- If you want to only view CPU statistics, you can run
dstatwith the--cpuflag by typingdstat --cpu. - For a more detailed glimpse at what’s under your Raspberry Pi’s hood, you can choose to add various plugins and options to your
dstatcommand, likedstat -C 0,1to view CPU usage by individual cores (if your Pi has more than one).
- Exiting
dstat:
- To stop
dstat, simply pressCtrl + Cin your terminal. This will return you to your regular command prompt.
Summary
The beauty of using dstat for monitoring CPU usage on your Raspberry Pi is in its simplicity and power. It gives you instant access to vital stats in an easily digestible format, which is perfect for beginners and experts alike. The ability to tailor the output with various options means that you won’t be overwhelmed with information overload. However, a potential downside for absolute beginners might be interpreting the data, as the output can still be somewhat cryptic without a basic understanding of system resources. Nevertheless, with a little bit of practice, dstat can become an indispensable tool in your Raspberry Pi utility belt.
10. Running sar
Introduction
The sar command stands for System Activity Report, which is part of the sysstat package. This valuable tool helps users to collect, report, and save system activity information. sar can provide a history of CPU utilization, memory usage, disk I/O, network performance, and more. As a user of a Raspberry Pi, whether it’s for learning purposes, running a home server, or engaging in hobbyist projects, monitoring your CPU usage can help you understand how your applications and services are performing. Because the Raspberry Pi has limited resources compared to full-fledged servers, keeping an eye on the CPU usage can be crucial for maintaining optimal performance. Utilizing sar, you can observe CPU usage over time and identify any unusual patterns or spikes that might suggest a need to optimize your processes.
Steps
Checking CPU usage on a Raspberry Pi using the sar command involves a few steps, as follows:
- Install the
sysstatpackage:
- Open a terminal prompt on your Raspberry Pi.
- Update your package list by running
sudo apt update. - Install the package by executing
sudo apt install sysstat. - During installation, you might be asked if you want to enable
sysstatto collect data. Make sure to select “yes” or enable it by editing/etc/default/sysstatusing a text editor likesudo nano /etc/default/sysstatand change the lineENABLED="false"toENABLED="true". - Start the data collection service with
sudo systemctl start sysstatand enable it to auto-start on boot withsudo systemctl enable sysstat.
- Check CPU Usage:
- Run the command
sar -u 1 5to check CPU usage in real-time. The-uflag reports on CPU utilization, the1is the interval in seconds between each report, and the5is the number of times you want the report generated. - Wait while the command collects data and prints out reports of CPU activity every second, five times.
- Look for the
%iowaitand%idlevalues, which can indicate if the CPU spends a lot of time waiting for I/O operations or is mostly idle.
- For historical data:
- The
sarcommand can also display historical CPU usage. By default,sysstatcollects data every 10 minutes and stores it in/var/log/sysstat/. - Run the command
sar -u -f /var/log/sysstat/sa$(date +%d -d yesterday)to see the CPU usage statistics for yesterday. Replaceyesterdaywithtodayor any other date as necessary.
Summary
The sar command from the sysstat package gives Raspberry Pi users a powerful way to monitor and analyze CPU usage over time, which can be extremely beneficial for optimizing performance and understanding system behavior. One of the main benefits of using sar is that you can collect historical data, which isn’t possible with many other monitoring tools.
However, since it needs to be explicitly installed and configured, some users may find it less convenient than tools that are available by default. Moreover, interpreting the data requires some basic understanding of system metrics and performance indicators. Despite these potential downsides, sar remains a vital tool in the arsenal of those who want to keep a closer eye on their Pi’s CPU activity and system health in general.
Conclusion:
Monitoring the CPU usage on a Raspberry Pi is a simple yet essential task for managing the performance of your device. Whether you opt for graphical tools like htop or leverage the built-in top command in the terminal, you can effectively keep an eye on your CPU’s workload. This guide should provide you with a clear pathway to understanding and checking your Pi’s CPU usage and enable you to troubleshoot performance issues or optimize your projects for better efficiency.
FAQs:
- Can I check CPU usage on Raspberry Pi without installing additional software?
Yes, you can use thetopcommand available by default in the terminal to check the CPU usage. - Is it possible to monitor CPU usage over time?
Definitely. Thehtoptool, once installed, offers a dynamic real-time view of CPU usage over time, among other capabilities. - Does high CPU usage harm my Raspberry Pi?
Consistently high CPU usage can lead to overheating, which may throttle performance or, in extreme cases, shorten the lifespan of your Pi. It’s essential to use proper cooling solutions and monitor usage to avoid these issues.