When dealing with a set of numbers, understanding the spread of that data is crucial for making well-informed decisions, especially in fields like finance, marketing, and public planning. One statistical tool for analyzing data variability is the Interquartile Range, or IQR. The IQR is the range within which the middle 50% of your data lies, and it’s especially useful for spotting outliers and understanding the data’s overall distribution. While calculating IQR might seem daunting, Excel offers functions and features that simplify this process, making it accessible even if you’re not a statistician.
Using the ‘QUARTILE’ Function
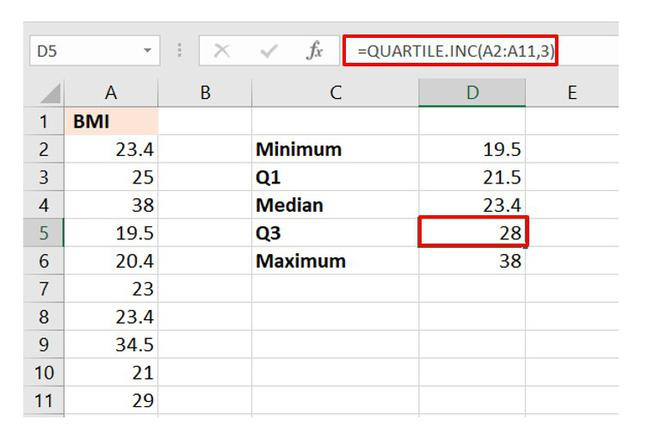
One of Excel’s built-in functions that can help in calculating the IQR is the ‘QUARTILE’ function. This function quickly computes quartiles for a data set, which are the values that divide your data into quarters.
Steps:
- Input your data into a single column.
- Identify the cell where you want your IQR result to appear.
- Enter the formula
=QUARTILE(array, 3) - QUARTILE(array, 1)into the cell. - Replace ‘array’ with the actual range of your data.
- Press ‘Enter,’ and Excel will display the IQR for your data.
Summary:
The QUARTILE function method is straightforward and doesn’t require you to sort your data beforehand. It’s efficient and less prone to error. However, since it’s a function, understanding the quartiles it references is important to avoid confusion.
Utilizing ‘PERCENTILE’ Function
Another function that can calculate IQR is ‘PERCENTILE’. Unlike ‘QUARTILE’, which has predefined quartiles, ‘PERCENTILE’ allows for more flexibility as you can define the exact percentiles you need.
Steps:
- Enter your data set in a column.
- Decide where you want to display the IQR.
- Type
=PERCENTILE(array, 0.75) - PERCENTILE(array, 0.25)into the cell. - Replace ‘array’ with your data’s cell range.
- Press ‘Enter’ to get the computed IQR.
Summary:
PERCENTILE is particularly useful when you need percentiles other than quartiles. It gives more control over the data analysis process but requires a clearer understanding of percentiles and their implications.
Conditional Formatting to Identify Outliers
After calculating the IQR, you might want to identify outliers in your data set. Excel’s conditional formatting feature can visually accentuate these outliers.
Steps:
- Calculate the IQR using one of the previous methods.
- Highlight your data set.
- Go to ‘Home’ > ‘Conditional Formatting’ > ‘New Rule.’
- Select ‘Use a formula to determine which cells to format.’
- Enter the formula for outliers based on the IQR.
- Choose a format for highlighting and click ‘OK.’
Summary:
Using conditional formatting can make outlier detection immediate and clear, improving data analysis and decision-making. However, incorrectly defining outlier criteria can result in misleading highlights.
Data Analysis Toolpak for Advanced Statistics
For more in-depth analysis alongside IQR, you can install Excel’s Data Analysis Toolpak which offers a range of statistical tools.
Steps:
- Click ‘File’ > ‘Options’ > ‘Add-Ins.’
- In the ‘Manage’ box, select ‘Excel Add-ins’ and click ‘Go.’
- Check ‘Analysis ToolPak’ and click ‘OK.’
- Once installed, go to the ‘Data’ tab and click ‘Data Analysis.’
- Select ‘Descriptive Statistics’ and proceed with your analysis.
Summary:
The toolpak allows a comprehensive study of your data set, including mean, median, standard deviation, and more, which complements the insights provided by the IQR. It’s a powerful addition to Excel but may be overwhelming without some statistical background.
Creating a Box and Whisker Plot
Visual representations can be as informative as numeric results, and a Box and Whisker plot is a classic way to show IQR and outliers.
Steps:
- Calculate the necessary statistics including IQR.
- Select your data, go to ‘Insert’ > ‘Insert Statistic Chart’ > ‘Box and Whisker.’
- Customize your chart from the ‘Chart Design’ and ‘Format’ tabs.
Summary:
A Box and Whisker plot is a valuable visual tool that instantly conveys the spread of your data, the IQR, and any outliers. It requires some initial setup and familiarity with Excel charts.
Sorting Data for Manual Calculation
If Excel functions feel too abstract, you can manually calculate the IQR by first sorting your data.
Steps:
- Enter your data into a column.
- Select your data and sort it by going to ‘Data’ > ‘Sort A to Z.’
- Count your data points to determine the positions of Q1 and Q3.
- Identify the values corresponding to Q1 and Q3.
- Subtract Q1’s value from Q3’s to get the IQR.
Summary:
Manual calculation provides a hands-on understanding of what IQR represents. However, it’s time-consuming and error-prone, especially with large data sets.
Using ‘MIN’ and ‘MAX’ Functions
To accompany your understanding of IQR, knowing the full range of your data can be useful. MIN and MAX functions can help you find the smallest and largest values, respectively.
Steps:
- Identify the cells for minimum and maximum values.
- Enter
=MIN(array)and=MAX(array)in respective cells. - Replace ‘array’ with your data set range.
Summary:
These functions give additional context to the IQR by showing the spread of all data points. They are simple to use but remember that they don’t provide information about data distribution or outliers.
IQR Relative to Median
Understanding how IQR relates to the median can provide more context. The median splits your data into two equal halves.
Steps:
- Find or calculate the median with the
=MEDIAN(array)function. - Compare the IQR to the median for a sense of data skewness.
Summary:
The relationship between IQR and median can indicate if your data is skewed to higher or lower values. It’s a straightforward comparison but assumes some fundamental knowledge about data distribution.
Copying IQR to Multiple Data Sets
Once you’ve mastered computing IQR for one data set, you may need to apply it across multiple sets.
Steps:
- Use the formula for calculating IQR on the first data set.
- Copy the formula down to apply it to other data sets in adjacent columns.
Summary:
This provides an efficient way to compare variability across different data sets. Be mindful of adjusting each formula to the correct range to avoid errors.
Avoiding Common Errors
Excel users may encounter errors when working with the IQR functions, like misidentifying the array range or using the wrong formulas.
Steps:
- Double-check the range of your data.
- Ensure that you use the correct formulas and syntax.
- Validate your results by cross-referencing with another method if possible.
Summary:
Careful attention can avoid most common errors, ensuring accurate results. However, there’s always a learning curve, and practice is key to proficiency.
Explaining IQR to Non-Technical Audiences
Once you’ve calculated the IQR, you may need to explain it to those who aren’t familiar with statistical terms.
Steps:
- Avoid technical jargon when explaining IQR.
- Use real-world examples to illustrate how the middle 50% of data values fall within the IQR.
- Refer to the previously created Box and Whisker plot as a visual aid.
Summary:
Effective communication involves simplifying complex concepts without oversimplifying. While challenging, it helps in making your analysis actionable for everyone.
In conclusion, the Interquartile Range is a powerful statistic for analyzing the spread of your data in Excel. Whether you’re a novice or a seasoned data analyst, the methods outlined above can help you perform this calculation and understand its significance in your overall data analysis. Over time, these tools and techniques become intuitive, turning complex data into clear, actionable insights.
FAQs
Q: Why is the IQR important?
A: IQR provides a measure of the middle spread of your data, which is less affected by outliers, and is therefore a reliable indicator of data variability.
Q: Can Excel calculate IQR for any size of the data set?
A: Yes, Excel can calculate the IQR for any set of numbers, regardless of size, as long as the data is entered correctly into the spreadsheet.
Q: Is it necessary to sort data before calculating IQR in Excel?
A: It’s not required to sort the data when using IQR functions (such as ‘QUARTILE’ or ‘PERCENTILE’), but sorting is essential if you’re manually calculating quartiles.
Q: What should I do if my IQR calculation results in an error?
A: Check your formula for correct syntax, ensure that your array range is accurate, and make sure that your data does not contain non-numeric entries that may cause errors.
Q: Can I calculate IQR for non-numeric data in Excel?
A: No, IQR calculations are specific to numeric data. Non-numeric data must be converted to numeric values, if possible, or processed differently.