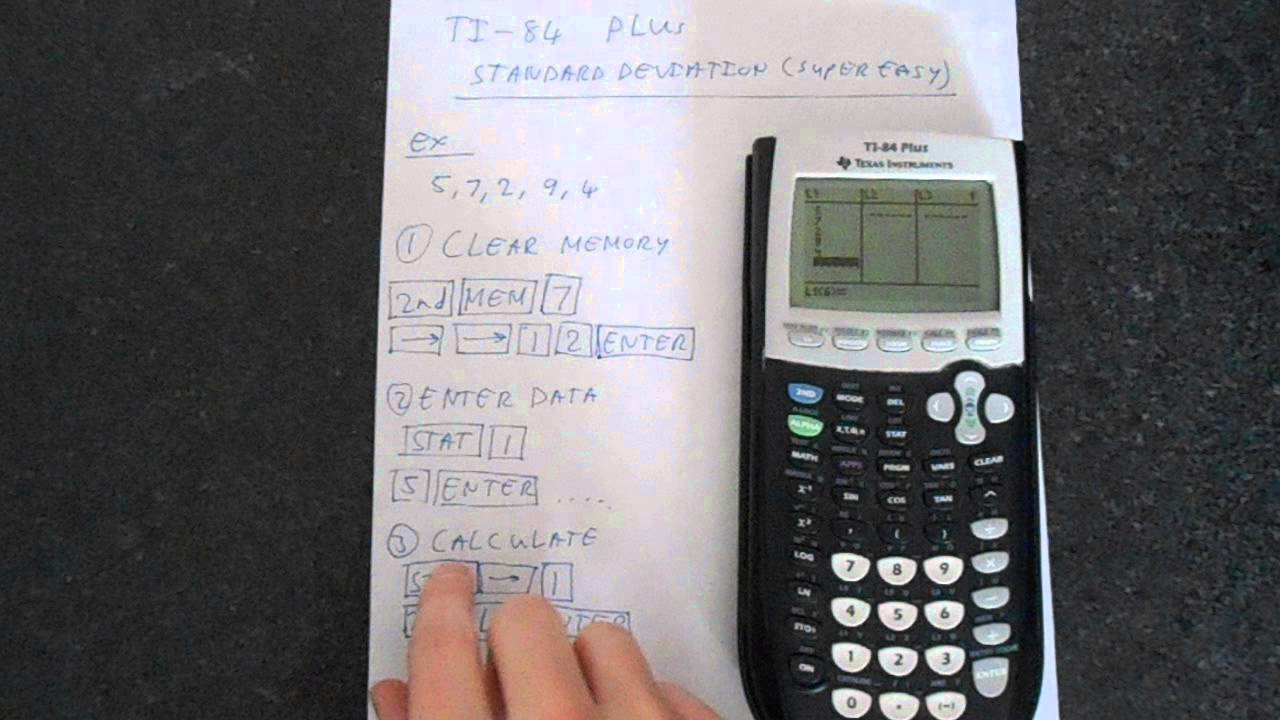
The TI-84 calculator, a stalwart companion in the realm of mathematics and statistics, offers a variety of functions to assist in calculating complex formulas with ease. One such indispensable tool is the ability to compute the standard deviation, a measure that indicates how spread out the numbers in a data set are. Stripping away the daunting statistical jargon, using the TI-84 for this purpose involves following a set of clear, step-by-step instructions to navigate its interface and efficiently arrive at the desired result.
Entering Data
Before crunching numbers, we first need to familiarize ourselves with the process of inputting data into the TI-84, which serves as the foundation for calculating standard deviation.
Detailed Steps:
- Turn on your TI-84 calculator.
- Press the
STATkey, which will bring up the statistics menu. - Select
1:Edit...by pressingENTER, to view and edit lists of statistical data. - Input each data point using the numerical keypad and press
ENTERafter each entry to move to the next cell in the list. - If you make an error, use the arrow keys to navigate to the incorrect entry, type the correct value, and press
ENTER.
Summary:
Entering your data accurately is critical to yielding a correct standard deviation. A potential downside is misentry of data, but with careful input and the ability to correct mistakes, this step should set a solid groundwork for your calculations.
Clearing Old Data
Having old or unwanted data in your lists can lead to incorrect calculations, so it’s important to learn how to clear these lists before adding new data.
Detailed Steps:
- Press the
STATbutton to bring up the statistics menu. - Use the arrow keys to navigate to the
4:ClrList. - Press
ENTER, then type the name of the list you wish to clear. For example,L1can be entered by pressing2NDand1. - Press
ENTERagain to clear the selected list.
Summary:
Clearing old data is an essential step to prevent errors in your calculation. The downside is accidental deletion of needed data, but as long as you proceed carefully and ensure the data is no longer required, this step will keep your data sets organized and ready for analysis.
Calculating Standard Deviation with One-Variable Stats
The one-variable statistics function is the most straightforward method for computing standard deviation on your TI-84. It efficiently handles both the sample and population standard deviation calculations.
Detailed Steps:
- Enter your data into the list as described in the “Entering Data” section.
- Once the data is inputted, press
STAT. - Arrow over to
CALC. - Select
1:1-Var Statsand then pressENTER. - If you have entered your data into
L1, just pressENTERagain. If your data is in a different list, key in that list’s name (e.g.,2ND2forL2) followed byENTER. - The calculator will display several statistics. Use the arrow down key to scroll to
sxfor the sample standard deviation orσxfor the population standard deviation.
Summary:
This method is convenient and quick, allowing you to receive comprehensive statistics beyond just the standard deviation. A potential limitation is that it can be overwhelming to see so many statistics at once for someone new to the TI-84, but the key takeaway statistics are suitably highlighted.
Two-Variable Statistics
Two-variable stats are helpful if you’re working with paired data sets and wish to analyze the standard deviation for both.
Detailed Steps:
- Enter the first data set into
L1and the second set intoL2. - Press
STAT, navigate toCALC, and select2:2-Var Stats. - Press
ENTERtwice if you’ve usedL1andL2. If not, enter the corresponding list names as prompted. - Scroll through the output for
SxandSy, which represent the sample standard deviations of the first and second data sets.
Summary:
Calculating two-variable statistics can be incredibly helpful for analyzing paired data. It’s slightly more complex than one-variable stats and can confuse beginners, but once mastered, it provides a richer data analysis.
Using the List Function for Standard Deviation
The TI-84 allows the use of functions directly on lists of data which can streamline the standard deviation calculation process.
Detailed Steps:
- Make sure your data is entered correctly into a list, usually
L1. - Press the
2NDkey and then0to bring up the catalog of functions. - Scroll down or press the corresponding alphabet key to find
stdDev(. - Select it and then type in the list name containing your data (e.g.,
2ND,1forL1). - Close the parentheses and press
ENTER.
Summary:
Using the list function can be a quick shortcut for those familiar with the calculator’s functions. However, its hidden nature in the catalog menu can make it less accessible for new users initially.
Alternate Entry for Standard Deviation
If you’re not using lists or prefer typing commands, there’s a direct formula entry method available.
Detailed Steps:
- Press
2NDand then0to open the catalog. - Find and select
stdDev(. - Type your data points directly into the parentheses, separated by commas.
- After the last data point, close the parentheses and press
ENTER.
Summary:
Directly typing the standard deviation formula affords precision and is ideal for quick, one-off calculations. However, the manual entry increases the risk of error. It’s not the best method for recurring calculations due to the need to retype data each time.
Error Checking and Troubleshooting
Ensuring that you’ve entered your data correctly and that the list is calculated correctly is crucial for an accurate standard deviation.
Detailed Steps:
- Go back to your data list by pressing
STATand selecting1:Edit. - Scroll through your entries to check for accuracy.
- If you find an error, correct it with the keypad and press
ENTER. - Recalculate your standard deviation following the earlier steps to ensure accuracy.
Summary:
Error checking is a vital, but sometimes neglected, part of using the TI-84 calculator. It adds a step to the process but drastically reduces the chances of incorrect results due to data entry errors.
Graphing Data Distribution
Graphing your data before calculating the standard deviation can provide a visual understanding of data spread and distribution.
Detailed Steps:
- Enter your data into a list.
- Press
2NDand thenY=to access theSTAT PLOT. - Select
1:Plot1and pressENTER. - Choose the type of plot (e.g., histogram, box plot) and the list your data is in.
- Press
GRAPHto view your data’s distribution.
Summary:
Graphing is useful for visual learners and provides a pictorial representation of how data points are spread out, which complements the numerical value of the standard deviation. It may require some understanding of different plot types and can be an extra step not necessary for direct calculation purposes.
Resetting the Calculator
Occasionally, your calculator settings may interfere with the standard deviation calculation. A reset can ensure that everything is working correctly.
Detailed Steps:
- Press
2NDand then+to access the memory menu. - Navigate to
7:Reset. - Select
1:All Ramor2:Defaults. - Press
ENTERand confirm the reset.
Summary:
Resetting restores the calculator to its default state, eliminating potential calculation inaccuracies due to altered settings. However, it will erase any programs or data, so it should only be done if completely necessary.
Using Stored Operations
For frequent use, storing the standard deviation operation as a program can save time.
Detailed Steps:
- Press the
PRGMbutton, navigate toNEW, and pressENTER. - Name your program and input the standard deviation formula and required list names.
- Run the program whenever needed by pressing
PRGM, selecting your program, and pressingENTER.
Summary:
This method saves time for regular users and standardizes the calculation across multiple uses. The downside is that programming requires a learning curve and initial time investment.
Help and Documentation
For continued learning and troubleshooting, make use of the TI-84’s built-in help resources and accompanying documentation.
Detailed Steps:
- Access the help menu through the TI-84 interface or press the
2NDand0keys to open the catalog for a list of functions. - Refer to the manual that came with your calculator or find resources online for detailed guides and examples.
Summary:
Having resources at your disposal is beneficial for expanding understanding and offering guidance. While very informative, sifting through documentation can be overwhelming for some users.
In conclusion, understanding how to calculate standard deviation on a TI-84 calculator is not just a technical skill but a doorway to deeper data analysis and interpretation. By learning the step-by-step process, users can transform raw data into meaningful insights, harnessing the full potential of their calculator. With patience and practice, overcoming the initial learning curve rewards users with a versatile tool for both academic and professional statistical endeavors.
FAQs
Q: What exactly is standard deviation used for?
A: Standard deviation is used to measure the amount of variation or dispersion in a set of values. It’s a key statistical tool that reveals how spread out the data points are from the mean (average).
Q: Do I need to understand statistics to calculate standard deviation on a TI-84?
A: While a basic understanding can be helpful, you don’t need to be an expert. Following the steps outlined for your calculator will allow you to calculate standard deviation without deep statistical knowledge.
Q: Can the TI-84 calculate standard deviation for grouped data?
A: Yes, the TI-84 can handle grouped data, but the process requires entering the data points according to their frequency, which might be slightly more complex than for ungrouped data.