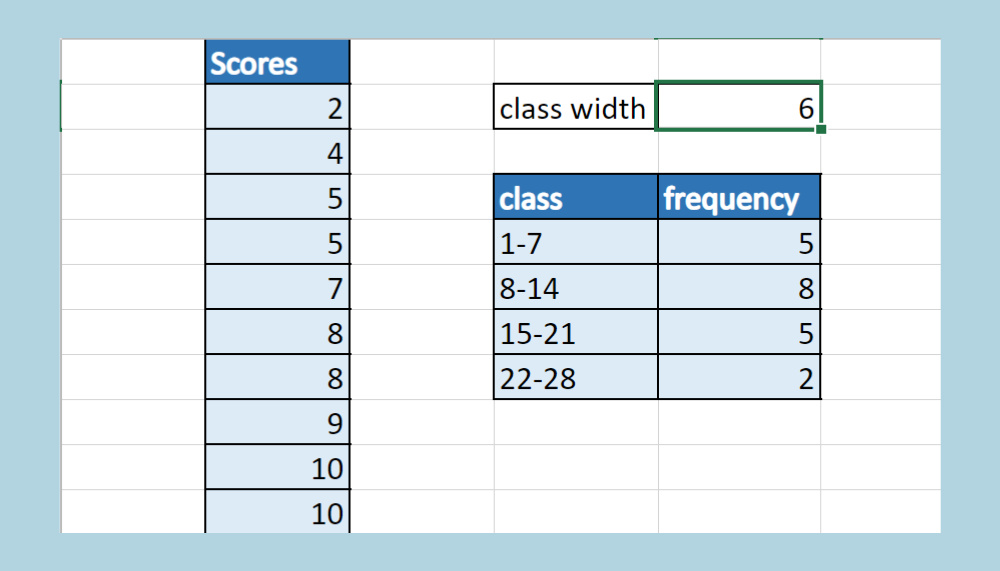
When faced with a set of data, organizing it into meaningful segments is key for analysis. This is where the concept of ‘class width’ comes in handy, particularly when creating histograms or frequency distributions. Class width is the range of values covered in each group or ‘class’ and is essential for consistency in your data representation. Understanding how to calculate this measurement will help you make accurate and insightful conclusions from your data sets.

Calculating Class Width with Range and Number of Classes
Before diving into histograms, you must determine how to divide your set of data. The class width gives uniformity to data presentation, making it easier to interpret. To get started with this method, you’ll need the highest and lowest values in your data set (the range) and a decision on how many classes you want to divide your data into.
- Identify the highest value (H) and the lowest value (L) in your data set.
- Calculate the range ? by subtracting the lowest value from the highest value (R = H – L).
- Decide how many classes (k) you would like to have. This can be subjective, but a common rule of thumb is to aim for between 5-20 classes.
- Divide the range by the number of classes to find the class width (Class Width = R/k). If this results in a fraction, round up to the next whole number to ensure that all data points are included.
Summary:
This approach provides a straightforward way to calculate class width using the range of your data and a chosen number of classes. It ensures that each class interval is of equal width. However, if your data includes outliers, this may skew the range and hence the class width, which is a potential downside to consider.
Using Sturges’ Formula for Class Number
Sturges’ formula offers a way to determine the number of classes, which can then be used to calculate the class width for a set of data. It’s particularly useful for large data sets and provides a starting point for creating a histogram.
- Count the number of data points (N) in your data set.
- Calculate the number of classes using Sturges’ formula: k = 1 + 3.322(log N), where log is the logarithm to the base 10. Round up to the nearest whole number since you can’t have a fraction of a class.
- Follow the previously outlined steps to calculate class width with your new number of classes (k).
Summary:
Sturges’ formula is beneficial for quickly calculating the number of classes, which is especially helpful for larger data sets. Although this method is easy to apply and provides a logical number of classes, it’s worth noting that it may not be the best choice for every data set, as it might oversimplify some distributions.
Approximating Class Width Using the Square Root Choice
The square root choice is a simple and commonly used approach to approximate the number of classes, which is key for determining class width in a data set.
- Find the total number of data points (N) in your data set.
- Take the square root of N. This gives you the approximate number of classes to use. Round up to the nearest whole number.
- Calculate the class width using the range of your data and the approximate number of classes from the square root.
Summary:
Taking the square root of the number of data points provides a quick and easy way to approximate the number of classes, leading to a calculation of class width. The method is best suited for small to medium-sized data sets; however, for very large sets, it might create too many classes and for very small sets, too few.
Rice Rule for Determining Class Number
The Rice Rule is an alternative method used to approximate the number of classes for a histogram, influencing the subsequent class width calculation.
- Count the number of data points (N) in your data set.
- Apply the Rice Rule to determine the number of classes: k = 2 * (N^(1/3)).
- Follow the process to divide the range by the number of classes according to the Rice Rule to get the class width.
Summary:
This rule is less commonly known but can be more accurate than others for certain data sets. It is useful for medium to large data sets, providing a more nuanced approach to the number of classes compared to other methods. However, the resulting number of classes might sometimes feel arbitrary and may require adjustment based on the data set’s specific needs.
Minimizing Class Width Variation
If your data set has outlier values, minimizing class width variations by adjusting class boundaries can produce a more representative histogram.
- Determine the preliminary class width using any of the previous methods.
- Look for outlier data points that might skew data distribution.
- Adjust class boundaries to incorporate outliers effectively without creating too wide a range. This may mean increasing the number of classes or slightly adjusting the class width.
Summary:
Adjusting class boundaries to minimize class width variation is especially important in distributions with outliers, as it creates a more representative view of the data. The downside is that it requires subjective judgment and may lead to non-uniform class widths.
Custom Interval Method
For specialized data sets, creating custom intervals may be necessary to calculate class width. This is an advanced technique and requires a thorough understanding of the data.
- Analyze the data set to determine natural breaks or groupings in the data.
- Create classes based on these natural intervals.
- Calculate the width of each class based on the intervals chosen.
Summary:
This method tailors class widths to the specifics of the data set, which can be particularly useful when there are natural groupings within the data. It allows for accurate and meaningful representation of data. However, this approach can be subjective and may lead to variable class widths, which requires caution in interpretation.
Tips for Choosing the Best Method
When deciding which method to use for calculating your class width, consider the following:
- The size of your data set.
- Whether your data set has outliers.
- The level of detail you need in your histogram.
- The ease and practicality of the calculation method.
Conclusion
Calculating class width is a foundational skill in data analysis, essential for creating clear, insightful histograms and frequency distributions. While this guide has outlined multiple methods and tips, the right choice depends on the nature of your data and the context of the analysis. Remember to consider the size of your data set, presence of outliers, and the desired level of detail to choose the most appropriate technique.
FAQs
Q1: What is class width in data analysis?
A1: Class width is the size of the interval in a frequency distribution or histogram. It’s the difference between the upper and lower boundaries of any class.
Q2: Why is it important to calculate class width?
A2: Determining accurate class width ensures a consistent and meaningful representation of data in histograms, allowing for easier comparison and analysis.
Q3: Should I always use the same number of classes for every data set?
A3: No, the number of classes can vary depending on the size and characteristics of the data set to best represent the data distribution.


