Understanding statistical concepts like the p-value can be challenging without a mathematical background. Yet, it’s a vital part of interpreting experimental results and research data. Thankfully, technology comes to the rescue with tools that simplify these complex calculations. The TI-84 is a popular graphing calculator that can assist in crunching these numbers. If statistics is not your strong suit, don’t worry; the TI-84 is user-friendly and I’m here to guide you through the process step-by-step.
Hypothesis Testing
When you’re dealing with statistical data, hypothesis testing allows you to make inferences about a population based on sample data. The p-value is an important number in this context, giving you an idea of how strong your results are.
Steps:
- Start by entering your data into the calculator. Press the [STAT] button, then select ‘1:Edit’.
- Enter your observed data into list L1 and your expected data into L2.
- Next, navigate to the test menu by pressing [STAT] and then scrolling right to ‘TESTS’.
- Choose the appropriate test for your hypothesis. For instance, for a chi-square test, select ‘C:χ-Test’.
- After selecting the test, the calculator will prompt you for the relevant lists and degrees of freedom.
- Once you’ve entered all the information, scroll down to ‘Calculate’ and press [ENTER].
- The calculator will display the test statistic and the p-value.
Summary:
This method is straightforward and especially useful for conducting a variety of hypothesis tests—each with the potential to compute the p-value. However, selecting the correct test is essential, and inputting data accurately is necessary to obtain valid results.
Correlation Coefficient
In statistics, correlation coefficients are used to measure the strength and direction of the relationship between two variables. The TI-84 can calculate the correlation coefficient, from which the p-value for the strength of the correlation can be determined.
How to Calculate the Correlation Coefficient:
- Input the X and Y data points into the calculator. After pressing [STAT], go to ‘1:Edit’ and input your X data into L1 and your Y data into L2.
- To ensure the calculator is set to calculate the correlation coefficient, press [2nd] followed by [0] to access the catalog. Scroll down to ‘DiagnosticOn’ and press [ENTER] twice.
- Now, press [STAT], scroll over to ‘CALC’, and select ‘4:LinReg(ax+b)’.
- Press [ENTER] to run the linear regression.
- Your TI-84 will now display the results, including the correlation coefficient ‘r’ and ‘r’.
Summary:
Calculating the correlation coefficient and subsequently determining the p-value provides insights into the relationship between variables. Be aware that the correlation does not imply causation, and a significant p-value should not be interpreted as evidence of a causal relationship.
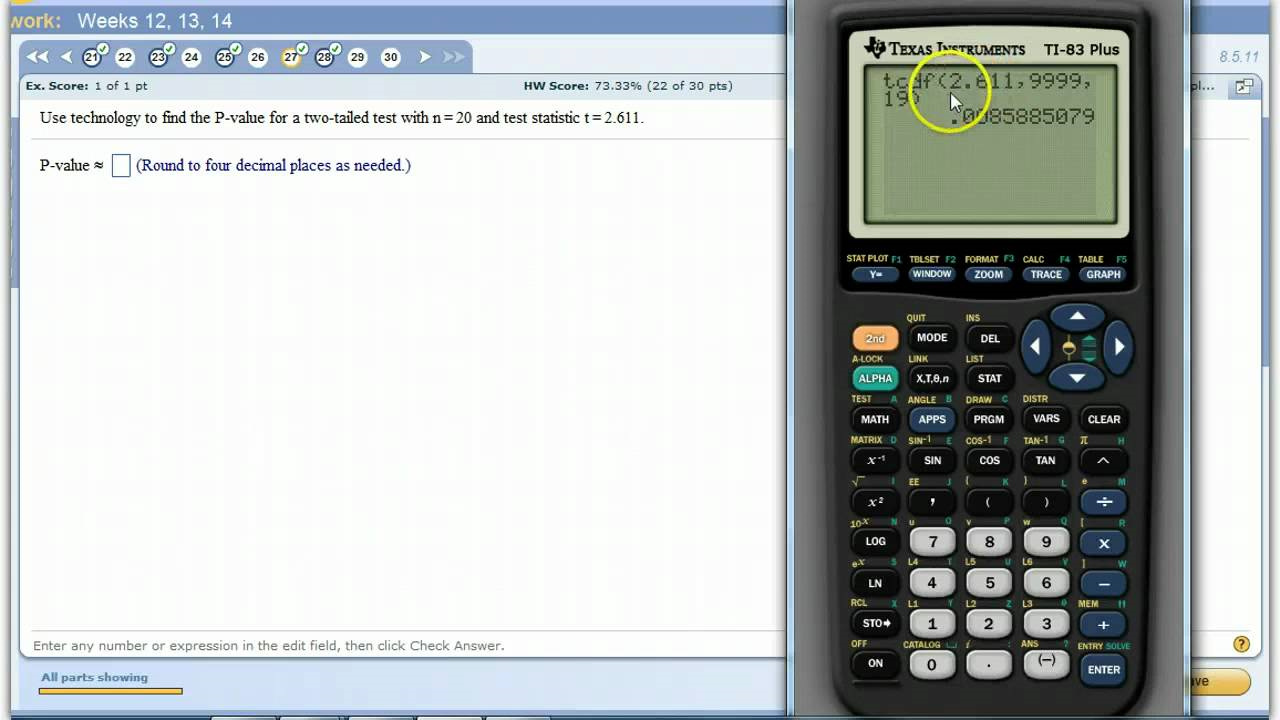
T-Test
The T-Test is a statistical test used to compare the mean of a sample to a known value (usually the population mean).
Steps for a T-Test:
- Enter your sample data into list L1 by pressing [STAT] > ‘1:Edit’.
- Navigate to the test menu by pressing [STAT] and scrolling right to ‘TESTS’.
- Select the appropriate T-Test, based on whether you have one sample or two.
- Input the necessary information such as the mean, the sample standard deviation, and the sample size.
- Scroll down to ‘Calculate’ and press [ENTER] to obtain the results, including the p-value.
Summary:
The T-Test function is excellent for comparing means, and the TI-84 makes this process efficient. The potential downside is that with small sample sizes, the test might not provide the most accurate estimate of the p-value.
Z-Test
Similar to the T-Test, a Z-Test compares sample data to a population, but with a known standard deviation.
Steps for a Z-Test:
- Enter your sample data into list L1.
- Access the ‘TESTS’ menu and select the appropriate Z-Test.
- Fill in the necessary parameters like population mean and standard deviation.
- Calculate to view the p-value.
Summary:
The Z-Test is another tool for hypothesis testing with larger sample sizes and known population standard deviations. Ensure that sample data is representative to avoid misleading p-values.
Chi-Square Goodness of Fit
This test is used to examine if a sample comes from a population with a specific distribution.
Steps for Chi-Square Goodness of Fit:
- Enter observed frequencies in L1 and expected frequencies in L2.
- Select ‘C:χ-Test’ from the ‘TESTS’ menu.
- Enter the degrees of freedom and calculate to find the p-value.
Summary:
This test is useful for categorical data and determining how well it fits expected distributions. It requires a categorical data set and might not be suitable for all types of data.
Tips and Tricks
Understanding the P-Value:
The p-value measures how likely your data would occur under the null hypothesis. Lower p-values indicate that your results are statistically significant.
Check for Updates:
Ensure your TI-84 calculator’s software is up to date to include all statistical features available.
Review Statistical Assumptions:
Each statistical test has its assumptions (normality, independence, etc.). Make sure your data satisfies these before running the test.
Using Lists Effectively:
Organize your data in lists to keep track of your samples for different tests.
Plotting Data:
Visualize your data using the TI-84 graphing capabilities to grasp the distribution and spot any outliers that might affect your p-value.
Avoiding Common Errors:
Double-check data entries and test choices, as incorrect inputs can lead to erroneous p-values.
In conclusion, calculating p-values on a TI-84 calculator can be a seamless process when you follow these steps and tips. It’s a potent tool that can make statistical analysis more approachable to those who might not be comfortable with complex mathematical formulas or software. Although the TI-84 is designed to be user-friendly, it’s important to select the correct statistical test and understand its assumptions to ensure the p-value is meaningful. As with any statistical analysis, use the p-value as one part of your interpretation, and remember that it’s a measure of probability, not proof.
FAQs:
-
What is a p-value?
The p-value is the probability of obtaining test results at least as extreme as the ones observed during the test, assuming that the null hypothesis is true. -
How do I know which statistical test to use on my TI-84?
It depends on your sample data, the hypothesis you are testing, and the assumptions of each test. Common tests include T-Tests for means, Z-Tests for populations with known standard deviations, and Chi-Square tests for categorical data. -
Can the TI-84 calculate p-values for all statistical tests?
The TI-84 is equipped to calculate p-values for many common statistical tests, but not all. For tests not supported by the TI-84, you may need to use statistical software or manual calculations.