Understanding how to calculate percent deviation is essential in various fields, including science, finance, and everyday problem-solving. Percent deviation helps us understand how much a certain value differs from a reference point or an average. It can be particularly handy when you’re trying to gauge the accuracy of measurements, the reliability of data, or identify outliers. By learning to compute percent deviation, you empower yourself with a tool to quantify precision and variation—a vital skill in many analytical tasks.
Basic Percent Deviation Formula
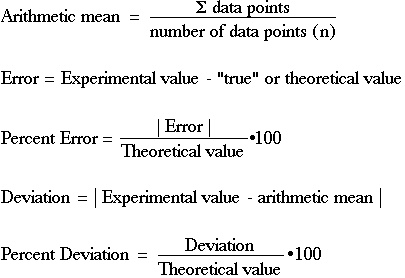
Before diving into more involved methods, it’s essential to grasp the basic concept of percent deviation. This is the foundation, it’s a calculation that helps gauge the extent of deviation.
Detailed Introduction
The basic percent deviation formula compares an observed value to an exact or accepted value to get the difference, or deviation, in percentage terms. It’s used widely in fields where precision matters, such as in scientific experiments or quality control processes.
Detailed Steps
- Identify the Accepted Value: Start by determining the accepted or exact value you’re comparing your measurement to.
- Identify the Observed Value: Note the observed value, which is the one you’re aiming to compare with the accepted value.
- Calculate the Absolute Deviation: Subtract the accepted value from the observed value, and take the absolute value of the result to ensure it’s positive.
- Divide by the Accepted Value: Take the absolute deviation and divide it by the accepted value.
- Convert to Percentage: Multiply the result from the previous step by 100 to get the percent deviation.
Summary
This method provides a clear and straightforward calculation that can be performed with minimal mathematical knowledge. One potential downside is that it doesn’t account for multiple measurements or provide context about the data set’s reliability.
Using Mean Absolute Deviation (MAD)
For data sets with multiple measurements, Mean Absolute Deviation can be a more informative measure.
Detailed Introduction
The Mean Absolute Deviation (MAD) calculates the average of the absolute deviations from a central point, typically the mean of the data set. This approach offers a broader overview of variability within a set of data.
Detailed Steps
- Calculate the Mean: Add all the individual values together and divide by the number of values to find the mean.
- Determine Absolute Deviations: Subtract the mean from each observed value and take the absolute value of these deviations.
- Find the Average of Deviations: Add up all the absolute deviations and divide by the number of observations to get the MAD.
- Express as a Percentage: If necessary, the MAD can be converted into a percentage by dividing by the mean and then multiplying by 100.
Summary
MAD provides a good sense of overall variability and is resistant to outliers. However, it can sometimes be less sensitive to individual variations since it focuses on the average deviation.
Applying Percent Deviation in Data Analysis
Understanding percent deviation is key when analyzing data for trends and outliers.
Detailed Introduction
In data analysis, percent deviation can help highlight which data points are significantly different from others and could be considered outliers.
Detailed Steps
- Calculate the Mean of the Data Set: Find the average value of all data points.
- Apply the Percent Deviation Formula to Each Data Point: Use the percent deviation formula to find the deviation of each data point from the mean.
- Identify Outliers: Look for data points with a percent deviation significantly higher than the rest, which may be outliers.
Summary
Applying percent deviation in data analysis is useful for identifying anomalies but requires careful interpretation, especially in diverse data sets where what’s considered ‘normal’ variation can be subjective.
Percent Deviation in Quality Control
High precision is key in manufacturing; percent deviation calculations can ensure standard compliance.
Detailed Introduction
In a production line, percent deviation can reveal variations in product dimensions or quality, highlighting consistency or the lack thereof in the manufacturing process.
Detailed Steps
- Set Quality Standards: Define what is considered an acceptable value or range.
- Measure Product Specifications: Obtain observed values for the product being assessed.
- Calculate Percent Deviation for Each Product: Use the percent deviation formula for individual products compared to set standards.
- Evaluate Results: Investigate products with high percent deviations to address potential process faults.
Summary
Using percent deviation in quality control helps maintain product uniformity. However, this could require a high volume of testing, depending on the number of products and the precision required.
Percent Deviation in Finance
Financial analysts use percent deviation to assess investment performance or budgetary compliance.
Detailed Introduction
In finance, percent deviation can compare actual returns or expenses against projected figures, helping assess financial health and stability.
Detailed Steps
- Determine Projected Figures: Identify the expected returns or budget.
- Record Actual Figures: Take note of the actual financial outcomes.
- Calculate Percent Deviation: Apply the percent deviation formula to the financial data.
- Interpret the Results: Assess whether deviations suggest a need for strategic changes.
Summary
This method provides financial insight but requires an understanding of the broader economic context since deviations may be influenced by external factors.
Percent Deviation in Education
Percent deviation can be a teaching tool in educational settings to measure test scores or performance variabilities.
Detailed Introduction
Educators may use percent deviation to determine how an individual student’s performance varies from the class average or expected standards.
Detailed Steps
- Establish a Baseline: Determine a standard or average score for comparison.
- Measure Student Performance: Obtain the score or performance measurement for the student.
- Calculate Percent Deviation: Apply the formula to the student’s performance relative to the baseline.
- Evaluate Educational Strategies: Use the information to tailor educational approaches to individual needs.
Summary
This application supports personalized education but must be handled sensitively to avoid mislabeling students based on a single metric.
Percent Deviation for Personal Goals
Setting and assessing personal goals become more effective with percent deviation metrics.
Detailed Introduction
Percent deviation helps individuals track progress towards personal benchmarks, such as weight loss goals or athletic performance.
Detailed Steps
- Identify Your Goal Benchmark: Define clear, numerical personal goals.
- Record Current Status: Keep track of your current measurements or performance.
- Calculate Percent Deviation: Use the formula to see how far you are from your goals.
- Adjust Actions Accordingly: Decide if your strategy needs refinement based on the deviation.
Summary
Personal goal analysis is empowered by percent deviation; however, it’s important to remember that individual progress can fluctuate over time.
Tips and Tricks for Accurate Percent Deviation Calculation
Detailed Introduction
Accuracy in percent deviation calculations is crucial to derive meaningful conclusions. Here are some tips and tricks to ensure that your computations are precise.
Detailed Steps
- Double-Check Values: Always verify the accuracy of both the accepted and observed values.
- Use a Calculator: For complex numbers or to ensure accuracy, utilize a calculator.
- Keep Significant Figures Consistent: Maintain the same number of decimal places across calculations.
Summary
Care in computation avoids errors that could lead to incorrect conclusions. However, the reliance on precise values means that any inaccuracy in data collection impacts the final result.
Common Pitfalls to Avoid
Detailed Introduction
While calculating percent deviation is straightforward, certain pitfalls can lead to errors or misinterpretation.
Detailed Steps
- Don’t Ignore Context: Always consider the broader scenario in which you’re applying the percent deviation.
- Avoid Rounding Errors: Be wary of rounding numbers too early in your calculation.
- Consider the Dataset Size: Remember that percent deviation may not tell the whole story in very small or very large datasets.
Summary
Avoiding common pitfalls enhances the reliability of percent deviation analysis. Still, the interpretation of deviation percentages requires careful thought beyond the raw numbers.
Conclusion
Calculating percent deviation is a fundamental skill that can be applied in a myriad of contexts to measure accuracy, consistency, and deviation from the norm. Whether it is utilized in scientific research, quality control, finance, education, or personal development, understanding the steps and nuances of this calculation can lead to more informed decisions and strategies. Remember that while the formula itself is quite simple, the real value lies in how you interpret and act upon the results it provides.
FAQs
Q: What does a high percent deviation indicate?
A: A high percent deviation typically indicates a large difference between an observed value and an accepted or average value, which may suggest inaccuracy, variability, or an outlier in the data.
Q: Can percent deviation be negative?
A: No, percent deviation is always expressed as a positive number because it represents the absolute value of the difference between an observed value and an accepted value, in percentage terms.
Q: Is percent deviation the same as percent error?
A: Percent deviation and percent error are similar in that they both measure the difference between an observed value and a reference value. However, percent error is often used more specifically in contexts where the reference value is a known, true value (such as in scientific measurements), while percent deviation may be used more broadly to compare any two values.