When it comes to understanding data, knowing your standing in a group can be crucial, especially when making comparisons. Percentiles are one way of doing this, offering a glimpse at where you rank relative to others. For example, if you score in the 75th percentile, you’ve outperformed 75% of your peers. But if the actual data points are unavailable, and all you have are the mean and standard deviation, you might think you’re at a dead end. Not to worry! With a little statistical insight, we can estimate percentiles from just those two pieces of information.
Calculating Percentile using Z-Score
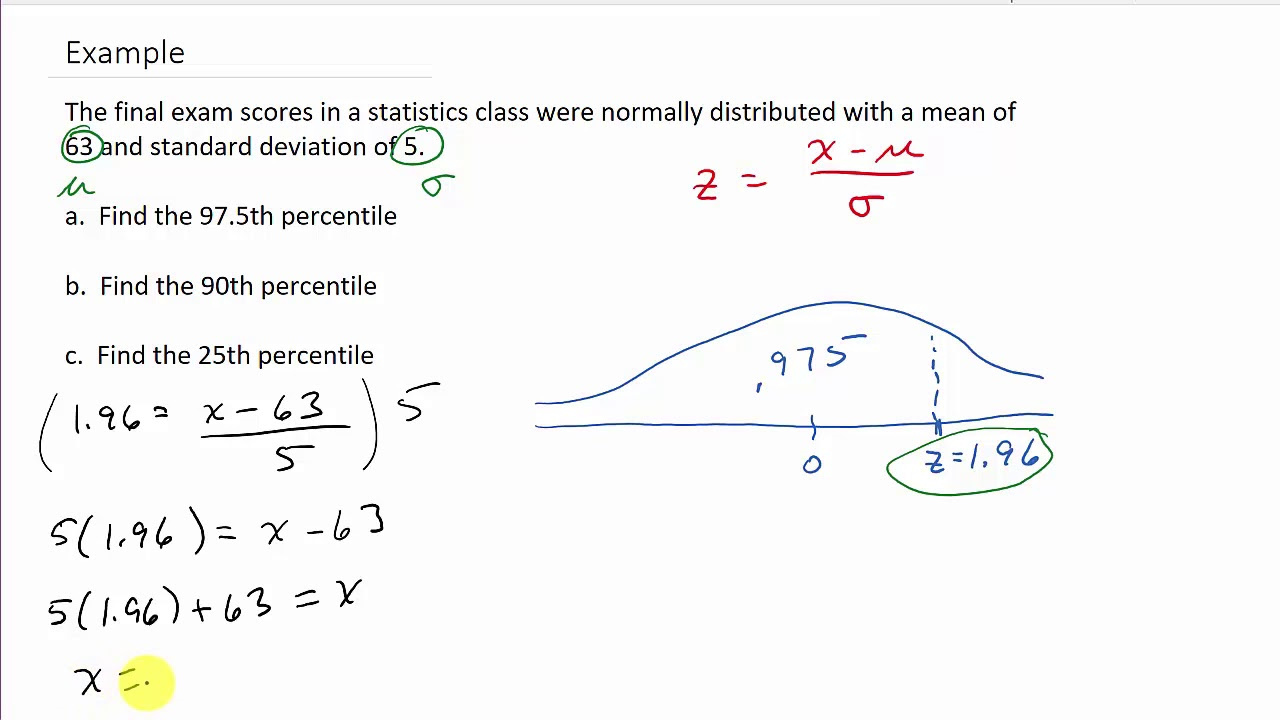
To estimate percentiles when you have the mean and the standard deviation of a dataset, you can use the Z-score formula. A Z-score tells you how many standard deviations away a value is from the mean.
Detailed Introduction
A Z-score can be converted into a percentile, which expresses the likelihood of a value occurring within a normal distribution. The process involves using the mean and standard deviation to find the Z-score, and then converting that Z-score into a percentile.
Detailed Steps
- Find out the value for which you want to calculate the percentile.
- Subtract the mean from your value.
- Divide the result by the standard deviation to get the Z-score.
- Use a Z-score table or statistical software to find the percentile that corresponds to the calculated Z-score.
Summary
This approach is beneficial as it is one of the most accurate ways to estimate a percentile from mean and standard deviation, providing clear comparative rankings. However, it assumes a normal distribution and might not be as precise with a different data distribution.
Normal Distribution Properties
Understanding the properties of the normal distribution can help with estimating percentiles without a Z-score table.
Detailed Introduction
The normal distribution, known as the bell curve, has a specific shape and set of characteristics. It’s symmetrical, with about 68% of values within one standard deviation from the mean, 95% within two, and 99.7% within three.
Detailed Steps
- Determine if your data is normally distributed.
- If it falls within the first standard deviation, estimate the percentile range between 16th and 84th percentile (as 68% of the data lies within one standard deviation from the mean).
- If it is within two standard deviations, it would be between the 2.5th and 97.5th percentile ranges, and so on.
Summary
This method is quick and easy but less precise. It’s beneficial for approximate estimations but not recommended when precise calculations are required.
Empirical Rule for Approximation
An empirical rule, also known as the 68-95-99.7 rule, can be used to estimate the range in which a certain percentage of the data lies.
Detailed Introduction
This rule is a simpler method that doesn’t require complex calculations. It is applicable only to normal distributions and provides a rough range rather than a specific percentile.
Detailed Steps
- Determine whether the value in question is within one, two, or three standard deviations from the mean.
- Use the empirical percentages (68%, 95%, or 99.7%) to estimate the percentile range.
- Remember that for one standard deviation, you take 68 and divide it evenly on both sides of the 50th percentile (the mean).
Summary
The empirical rule is a handy shortcut, giving a ballpark figure that can be sufficient in certain contexts. However, it does not provide a specific percentile, and accuracy isn’t guaranteed, especially for skewed distributions.
Standard Normal Distribution Table
A standard normal distribution table can be used when high precision is essential.
Detailed Introduction
Also known as the Z-table, this table gives you the percentile for any Z-score in a standard normal distribution. It’s more precise than the empirical rule and doesn’t require approximation.
Detailed Steps
- Calculate the Z-score using the value, mean, and standard deviation.
- Look up the Z-score on the Z-table to find the corresponding percentile.
- If the score is positive, read off the table directly. For a negative score, subtract the table value from 1.
Summary
This method offers precision but requires access to a Z-table and some understanding of how to read it. It’s excellent for normal distributions but less useful otherwise.
As we delve deeper into other methods and tips for percentile calculation, it’s clear that understanding your data’s distribution is crucial. With accessible arithmetic and the right tools, estimation of percentiles becomes a more approachable task, opening the door to insightful data analysis.
Conclusion
Grasping how to calculate percentiles using mean and standard deviation can empower you to understand data with limited information. By leveraging statistical methods like Z-scores and empirical rules, you can uncover vital insights that aid in decision-making and performance evaluation. Remember, the key is to recognize the distribution of your data and select the most fitting approach. Although some methods offer approximations, they provide a pathway to understanding where a particular value stands within a group, which is often invaluable information.
FAQs
Q1: Can I calculate a precise percentile without the actual data?
A1: You can estimate a percentile using the mean and standard deviation if you assume a normal distribution. However, for absolute precision, the raw data is usually necessary.
Q2: Do these methods work for any dataset?
A2: These methods are best suited for datasets that are normally distributed. If the dataset is skewed or has a different distribution, other methods may be needed.
Q3: How does a Z-score table work?
A3: A Z-score table displays the percentage of values that fall below a given Z-score in a standard normal distribution. You find the Z-score based on your value, mean, and standard deviation, then use the table to find the corresponding percentile.
Q4: What if the data is not normally distributed?
A4: If the data is not normally distributed, you’ll need to employ different statistical methods or transformations to accurately estimate percentiles.
Q5: Is knowing the percentile of a value beneficial?
A5: Yes, knowing the percentile can provide comparative information about where a value stands in relation to others, which can be helpful in various fields such as education, finance, and psychology.