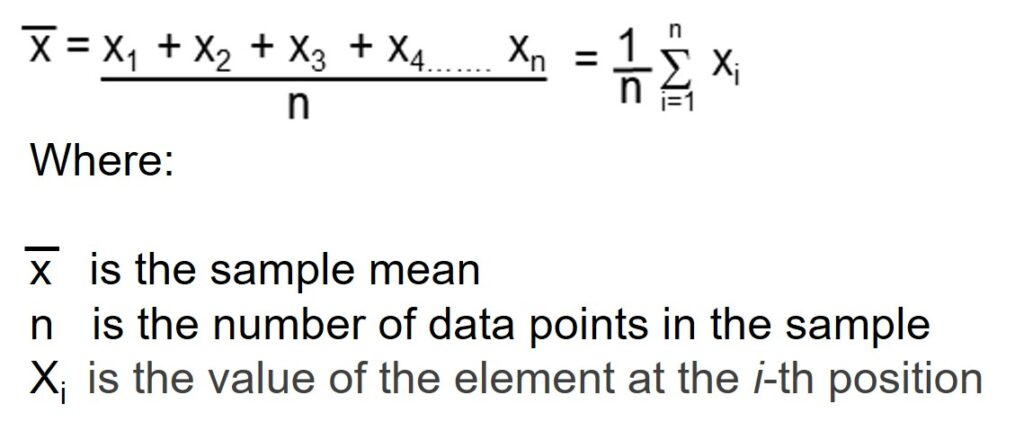
When embarking on a task that involves statistical analysis, understanding the concept of “xbar”, or the mean, is crucial. It serves as a cornerstone for numerous analytical techniques and provides valuable insights into the nature of a data set. Calculating the average, or xbar, is a fundamental process that finds its utilization in various fields including business, science, and education. To the uninitiated, it might seem daunting, but breaking it down into manageable steps makes it accessible to everyone.
Using a Calculator
Calculating the mean might seem technical, but with a calculator, it becomes a straightforward task. This method is perfect for those who are more comfortable with electronic devices and want quick results.
- Gather all the numerical values from your data set.
- Add all these numerical values together to get a sum total.
- Count the number of individual values you have added.
- Use your calculator to divide the sum total by the number of values.
- The number you get from this division is your xbar.
Summary:
The calculator method is simple and efficient, allowing for fast computation with minimal chance of human error. However, it might not be suitable for large data sets where manual input can be tedious and prone to mistakes.
Spreadsheet Software
If you find yourself dealing with a large set of numbers, spreadsheet software such as Microsoft Excel or Google Sheets can be invaluable in calculating xbar.
- Enter each value of your data set into individual cells in a column of the spreadsheet.
- Click on an empty cell where you would like the xbar to appear.
- Use the AVERAGE function by typing
=AVERAGE(range)into the cell, withrangebeing the group of cells containing your data. - Press “Enter,” and the spreadsheet will calculate the mean automatically.
Summary:
Spreadsheet software can handle vast amounts of data effortlessly and reduces errors significantly. However, a basic understanding of how to use the software is required, which could be a barrier for some users.
Manual Calculation
For some, the satisfaction of calculating things by hand is incomparable, and it also helps in grasping the basics of statistical analysis.
- Write down all the numbers from your dataset.
- Sum these numbers to find the total.
- Count the numbers to determine how many there are.
- Divide the total sum by the count of numbers.
- This result is your xbar.
Summary:
Manual calculations can enhance your understanding of the average concept. Yet, this method is time-consuming and more susceptible to human errors, especially with large data sets.
Counting on Fingers
Believe it or not, for very small data sets, you can use your fingers to calculate the xbar!
- Assign each finger a value from your data set.
- Add the values together using your fingers to keep track.
- Remember the total count of your fingers used.
- Divide the total of values by the count of fingers.
- The result will be your xbar, represented on your fingers.
Summary:
Counting on fingers is a tactile way to understand averages, ideal for very small sets of data. However, it’s impractical for more than ten values and lacks precision for non-whole numbers.
Education Apps
There are various apps designed to help with teaching the concept of xbar.
- Download an education-focused app that covers basic statistics.
- Input your data values into the provided fields.
- Follow the app’s instructions to calculate xbar.
- Review the explanation provided by the app for better understanding.
Summary:
Education apps provide interactive and guided learning, often with visual aids. But, reliance on digital explanations might not suit all learning styles, and app quality varies greatly.
Online Calculators
For quick answers without the need to download or install anything, online calculators are a great resource.
- Search for an online “average calculator” using your preferred search engine.
- Enter your data values into the calculator’s fields.
- Click ‘Calculate’ to get the xbar.
- Interpret the results using the guidance on the website if needed.
Summary:
Online calculators are accessible and user-friendly. Nevertheless, they require an internet connection and can be less educational than manual methods.
Visual Estimation
Sometimes a rough estimate of the xbar is sufficient, and visual methods can be helpful.
- Plot your data values on a number line.
- Eyeball the center of the data distribution.
- Estimate the mean value based on your visual assessment.
Summary:
Visual estimation gives a quick, intuitive sense of the average, which can be useful for conceptual understanding. However, it lacks precision and should not be used when accurate calculations are needed.
Educational Videos
For those who learn better from visual and auditory cues, educational videos can be a powerful tool.
- Find a reputable educational channel or resource with videos explaining how to calculate xbar.
- Watch the video(s) and follow along with your own set of data.
- Pause and replay parts of the video if you need to spend more time on specific steps.
Summary:
Videos can break down complex concepts into easy-to-understand components, often enhancing retention. The main downside is that passive watching without active practice can limit the effectiveness of the learning experience.
Math Games
Gamification can make learning how to calculate xbar more engaging and enjoyable.
- Find a math game that includes averaging numbers.
- Play through the levels, using the game’s system to calculate xbar from the given data.
- Use the feedback from the game to correct and improve your methods.
Summary:
Math games introduce an element of fun and competition, which can increase motivation and engagement. The downside is that these games may oversimplify concepts, and prolonged gameplay might be necessary to cover all learning aspects.
Asking for Help
Never underestimate the effectiveness of asking a knowledgeable friend, family member, teacher, or tutor for help.
- Approach someone who is good at math and explain that you want to learn how to calculate xbar.
- Have them show you the process step-by-step.
- Practice under their guidance until you are confident doing it on your own.
Summary:
Personal instruction allows for immediate feedback and tailored explanations, which can accelerate learning. The limitation is that it relies on the availability and expertise of the person you ask for help.
In conclusion, understanding and calculating xbar, the arithmetic mean, is essential in many fields as a measure of central tendency. Whether by using technology such as calculators and spreadsheet software or by employing more tactile and visual methods like counting fingers or estimation, there’s a way that can work for everyone’s learning style and needs. The key is to find the method that resonates best with you, practice it, and apply it to real-world data to grasp its practical applications fully.
FAQs
-
What is xbar and why is it important?
Xbar represents the average value in a set of data, which is important because it provides a central point to compare individual data points to and is used in many predictive models. -
Can I calculate xbar for any type of data?
You can calculate xbar for any numerical data set where an average is meaningful. However, for certain distributions or types of data, other measures of central tendency, like the median or mode, might be more appropriate. -
What is the difference between xbar and the median?
Xbar is calculated by taking the sum of all values and dividing by the total count, giving the arithmetic mean. The median is the middle value when all data points are arranged in ascending order; it differs from xbar in that it is less affected by outliers and skewed data.