In the world of data analysis and modeling, you might often hear about ‘y hat’. But what does it signify? Simply put, ‘y hat’ is a term used in statistics to denote the predicted values of a variable in a data set. It’s a way of seeing into the future, at least as far as trends and patterns are concerned. Calculating ‘y hat’ can range from simple arithmetic to more complex statistical techniques, depending on the context and data available. In this guide, we’ll unpack methods to compute ‘y hat’, making sense of predictions in your data.
Linear Regression Model
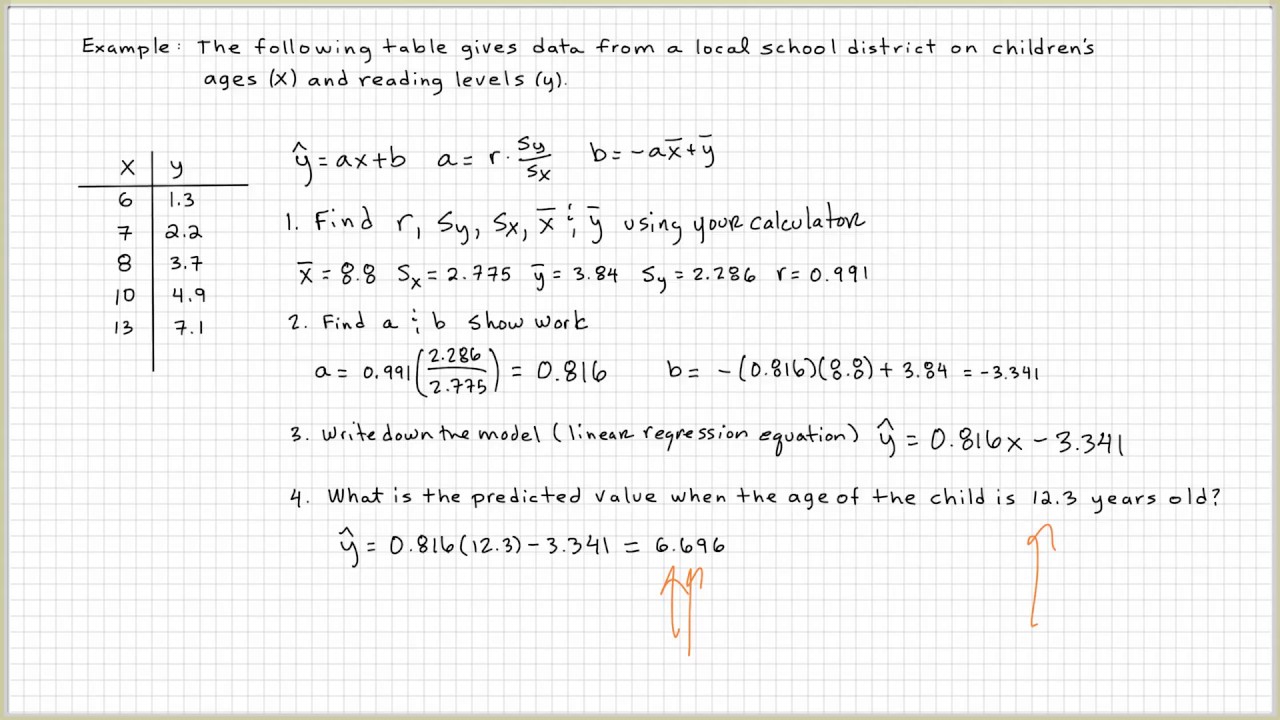
Before you dive into calculating ‘y hat’, you need to understand the concept of linear regression. It’s a statistical method that predicts the value of one variable based on the value of another. Imagine trying to predict your gas expenditure based on miles driven. In this scenario, miles would be the independent variable, while gas costs would be the dependent variable you’re trying to predict.
Detailed Steps
- Gather your data: You need two sets of data, the independent variable (x) and the dependent variable (y).
- Calculate the mean (average) of the x-values and y-values.
- Compute the slope (m): This tells you how steep your prediction line will be.
- Calculate the y-intercept (b): This is where your line starts on the y-axis if x is zero.
- With your slope and y-intercept, create the regression line equation: y hat = mx + b.
- Plug in the x-value to the equation to get the value of y hat, your predicted y-value.
Summary
The Linear Regression Model is a great starting point for beginners due to its simplicity and broad application. It’s quite intuitive and can provide a good approximation in many scenarios. However, it has limitations in handling non-linear relationships and can oversimplify complex data patterns.
Correlation Coefficient Method
The Correlation Coefficient Method offers insight into the relationship between two variables before calculating ‘y hat’. A correlation coefficient close to 1 or -1 indicates a strong relationship, which means predictions can be more precise.
Detailed Steps
- Obtain your x and y data sets.
- Calculate the mean of the x-values and y-values.
- Compute the correlation coefficient ? to understand the strength and direction of the relationship.
- Calculate the standard deviation of x and y.
- The slope (m) is r multiplied by the standard deviation of y divided by the standard deviation of x.
- Find the y-intercept (b) using the mean values and slope.
- Use the equation y hat = mx + b to predict y given x.
Summary
The Correlation Coefficient Method is valuable when you need to ensure that there’s a significant relationship between your variables before making predictions. While more comprehensive than the first model, interpreting correlation coefficients and calculating standard deviations may be complex for beginners.
Ordinary Least Squares (OLS)
OLS is a more refined method of finding an accurate line of best fit for your data. It minimizes the discrepancies between observed values and predicted values.
Detailed Steps
- Collect your x and y data points.
- Use statistical software or a calculator function to find the OLS equation. This usually involves solving a set of equations derived by setting the derivative of the sum of the squared differences between observed and predicted values to zero.
- Once you have the OLS equation, use it to predict y hat for any given x.
Summary
While OLS provides precise and optimized ‘y hat’ values, the computation can be quite mathematical and may require software aids. It’s excellent for pinpoint analysis but might be a bit overwhelming for statistical newbies.
Gradient Descent Method
Gradient Descent is a sophisticated optimization algorithm used to minimize the difference between the observed values and the predicted values by iteratively adjusting the slope (m) and y-intercept (b).
Detailed Steps
- Initialize with a random slope (m) and y-intercept (b).
- Calculate the gradient (the direction of the steepest increase) of the error function.
- Update the slope and intercept by moving a little in the opposite direction of the gradient.
- Repeat steps 2 and 3 until the changes are very small, indicating you have found the minimum.
Summary
This method is perfect for very large data sets or more complex models where traditional methods are not practical. However, it does require a basic understanding of calculus and can be computationally intensive.
Polynomial Regression
When data show a curvilinear relationship, Polynomial Regression comes into play, fitting a non-linear equation to the data, which allows for a broader range of prediction.
Detailed Steps
- Identify the degree of the polynomial required to fit your data best.
- Arrange your data points (x and y) in the equation y hat = a + bx + cx + … (where ‘a’, ‘b’, ‘c’, etc., are coefficients).
- Use statistical software to calculate the coefficients that will give you the best fit polynomial.
Summary
Polynomial Regression is suited for complex data with non-linear trends. Though it provides a flexible model, it increases the risk of overfitting the data (too closely matching the dataset, which impacts the model’s predictive power on new data).
Multiple Regression Analysis
Multiple Regression Analysis is used when there are two or more independent variables affecting the dependent variable.
Detailed Steps
- Gather your dataset with multiple independent factors (x1, x2, …) and your dependent variable (y).
- Calculate coefficients for each independent variable using statistical software.
- Formulate the multiple regression equation: y hat = b0 + b1x1 + b2x2 + …
- Predict y values using this equation based on known x values.
Summary
Multiple Regression is very useful for complex models with multiple influences, providing a broader understanding. Its complexity requires statistical software and a deeper understanding of analysis, which can be intimidating for novices.
Using Excel for Linear Regression
Excel is a user-friendly tool that can perform regression analysis, providing you with the ‘y hat’ values without delving deeply into the mathematics.
Detailed Steps
- Enter your data into Excel.
- Use the Chart tool to create a scatter plot.
- Add a trendline to the chart.
- Display the trendline equation on the chart and the R-squared value.
- Use the trendline equation to calculate y hat for a given x.
Summary
Excel’s regression feature is accessible for most users and provides a visual understanding of the data. However, the level of accuracy and detail is not as high as with specialized statistical software.
Online Calculators
Online calculators can be a simple way to find ‘y hat’ values without any specialized software or in-depth statistical knowledge.
Detailed Steps
- Search for an online regression calculator.
- Input your data points into the calculator.
- Follow the instructions provided to compute your ‘y hat’.
Summary
Online calculators are straightforward and convenient for quick calculations but might lack the robustness and flexibility data analysis sometimes requires.
Statistical Software Solutions
Software like SPSS, R, or Python libraries can provide sophisticated ways to calculate ‘y hat’ but require some technical know-how.
Detailed Steps
- Input your data into the software.
- Use pre-built functions to compute regression analysis or write your code to do so.
- Interpret the output to determine the ‘y hat’ values.
Summary
Using these software solutions can yield very accurate results and handle complex analyses but require a learning curve, which can be steep for those not tech-savvy.
Consulting a Statistician
Sometimes the best ‘solution’ is consulting with a professional statistician. This ensures your ‘y hat’ calculations are accurate and meaningful without you needing to understand all the technical details.
Summary
It’s the most professional approach and can provide custom solutions and deep insights, but it’s also likely the most costly option and can be time-consuming.
In conclusion, calculating ‘y hat’ can seem daunting, but a multitude of paths are available, whether you prefer a simple, hands-on tool like Excel or more rigorous statistical software. Each method comes with its advantages and complexities, but understanding the basics of ‘y hat’ and the principles behind it is key for any budding analyst or enthusiast. ModelRendererFAQs
FAQs
Q1: What is ‘y hat’ used for?
A1: ‘y hat’ is used for making predictions about values in data analysis, based on a model built from known data points. It’s a way to apply insights gained from past data to forecast future trends or behaviors.
Q2: Do I always need software to calculate ‘y hat’?
A2: Not necessarily. For simpler linear regression models, tools like Excel or even a calculator could suffice. However, for more complex analyses, specialized statistical software might be required.
Q3: Is it possible to accurately predict outcomes with ‘y hat’?
A3: While ‘y hat’ offers predictions based on statistical models, it’s important to remember that predictions are not certainties. The accuracy of ‘y hat’ values depends on the quality of the data and the appropriateness of the model used.